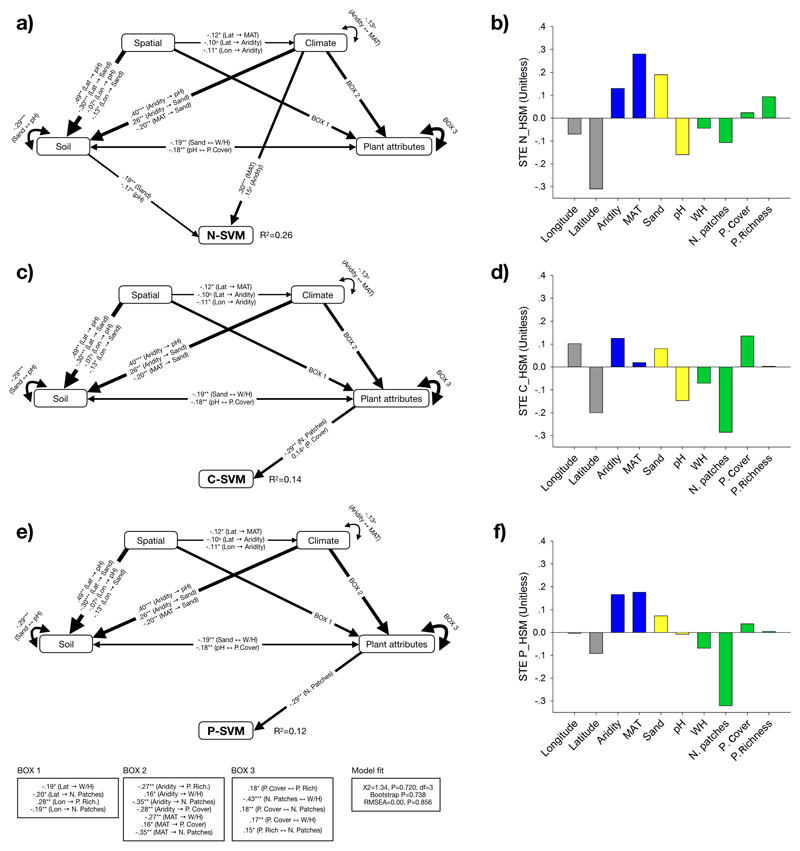
Figure 4.
Effects of mean annual temperature, aridity, soil variables (pH and sand content), biotic attributes (plant cover and richness, number of plant patches, and woody to herbaceous cover ratio [W/H]) and geographical coordinates (longitude and latitude) on the spatial variability (coefficient of variation) of the soil multifunctionality of N- (a), C- (c), and P-(d) related variables (N-SVM, C-SVM, and P-SVM, respectively). Numbers adjacent to arrows are standardized path coefficients, analogous to relative regression weights, and indicative of the effect size of the relationship. *P<0.05 and **P<0.01. Only significant relationships (P<0.05) are shown. Arrow widths are proportional to the strength of the relationship. Squares are observable variables. The proportion of variance explained (R2) appears alongside the response variable in the model. Goodness-of-fit statistics for each model are shown in the bottom (d.f.= degrees of freedom; RMSEA = root mean squared error of approximation). The components within spatial geolocation, climate, soil (properties) and plant attributes are included as independent observable variables in the model, however we group them in the same box in the model for graphical simplicity. Plots (b), (d) and (f) show the standardized total effects (direct plus indirect effects derived from the structural equation models) of N-SVM, C-SVM, and P-SVM predictors, respectively.

