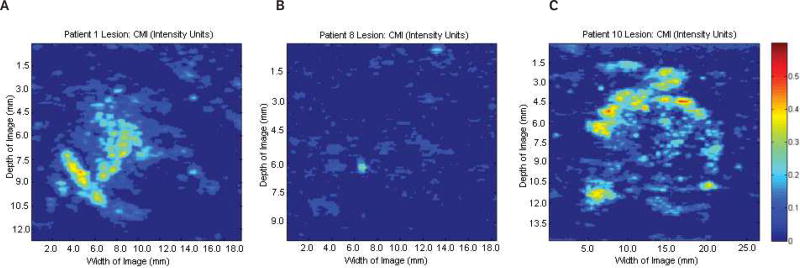
Figure 2.
Parametric images at the regions of interest showing cumulative maximum intensity (CMI) of the same 3 lesions shown in Figure 1. A, Benign fibroadenoma. B, Subdermal scar. C, Invasive malignant papillary carcinoma. No significant variations in cumulative maximum intensity were detected among the groups (P = .80). Scale bar indicates 0 to 0.6 intensity units.

