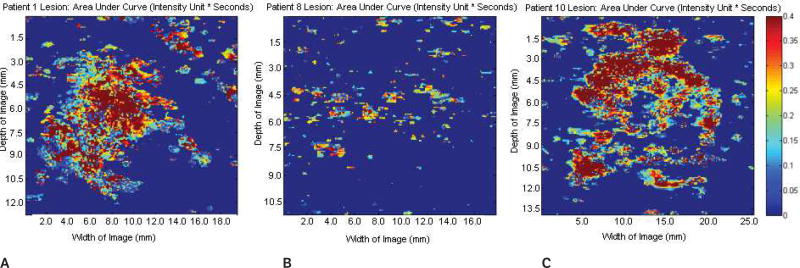
Figure 5.
Parametric images at the regions of interest showing the area under the time-intensity curve of the same 3 lesions shown in Figures 1–4. A, Benign fibroadenoma. B, Subdermal scar. C, Invasive malignant papillary carcinoma. No significant variations in the area under the curve were detected among the groups (P = .65). Scale bar indicates 0 to 0.4 intensity units/s.

