Figure 1.
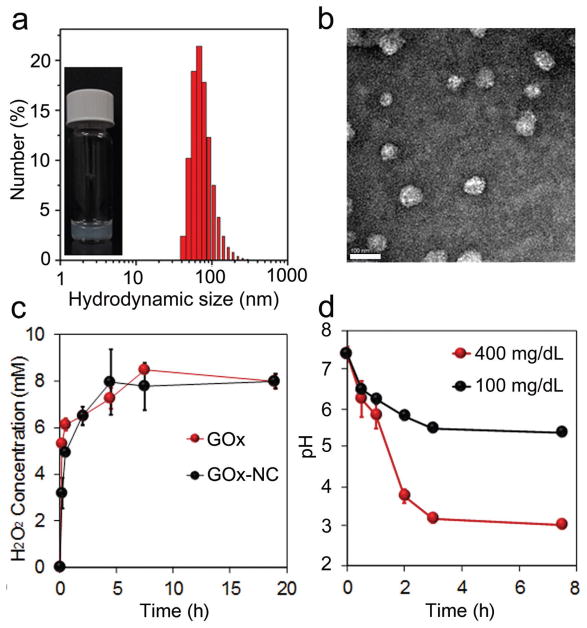
Characterizations of Ins-NCs and GOx-NCs. a) Representative image of Ins-NC solution and hydrodynamic size distribution of Ins-NCs as determined by DLS. Inset: A representative picture of the Ins-NC solution sample (insulin concentration: 1 mg mL−1). b) Representative TEM image of Ins-NCs. Scale bar, 100 nm. c) H2O2 generation in PBS (10 × 10−3 M, pH 7.4) containing glucose (400 mg dL−1) as catalyzed by GOx and GOx-NCs. d) The pH change of PBS solution of various glucose concentrations (100 or 400 mg dL−1) in the presence of GOx-NCs (0.2 mg mL−1 GOx-eq. concentration). Data points represent mean ± SD (n = 3). Error bars indicate SD.

