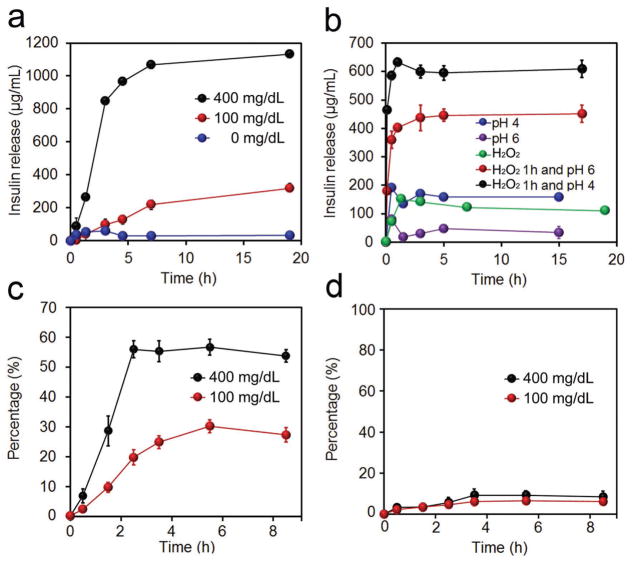
Figure 2.
In vitro characterization of glucose-responsive insulin release. a) Glucose concentration-dependent insulin release from a complex of insulin in PBS 7.4 in the presence of GOx (0.2 mg mL−1). The glucose concentration was set as 0, 100, and 400 mg dL−1. b) H2O2 (5 × 10⁻³ M) and pH cascade-triggered insulin release from a complex of insulin. c) Glucose concentration-dependent insulin release from Ins-NCs loaded in m-PVA gel in PBS 7.4 in the presence of GOx (0.2 mg mL−1). d) Glucose concentration-dependent GOx release from GOx-NCs encapsulated in m-PVA gel in PBS 7.4. Additional GOx (0.2 mg mL−1) was added. The glucose concentration was set as 100 and 400 mg dL−1. Data points represent mean ± SD (n = 3). Error bars indicate SD.

