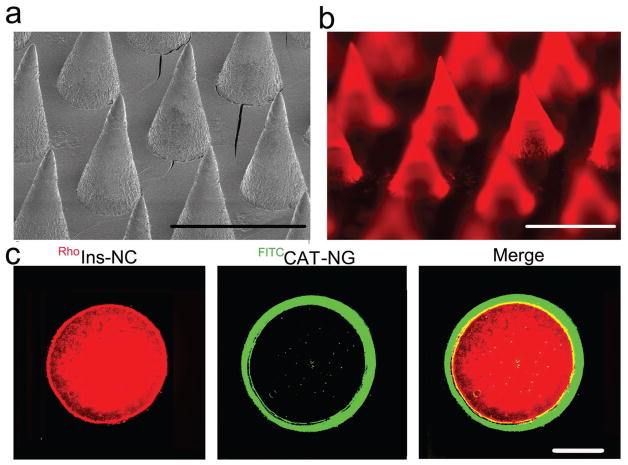
Figure 3.
Characterization of the MN array patch with a sheath structure. a) Representative scanning electron microscopy (SEM) image of microneedle array patch. Scale bar, 600 μm. b) Representative fluorescence microscopy image of MN arrays loaded with rhodamine B-labeled insulin. Scale bar, 600 μm. c) Representative images of a cross-section of MN with a CAT-NG sheath:rhodamine B-labeled insulin (red), FITC-labeled CAT sheath layer (green), and merging of both images. The sheath layer was 23 ± 6 μm thick as analyzed using software ImageJ. Scale bar, 100 μm.

