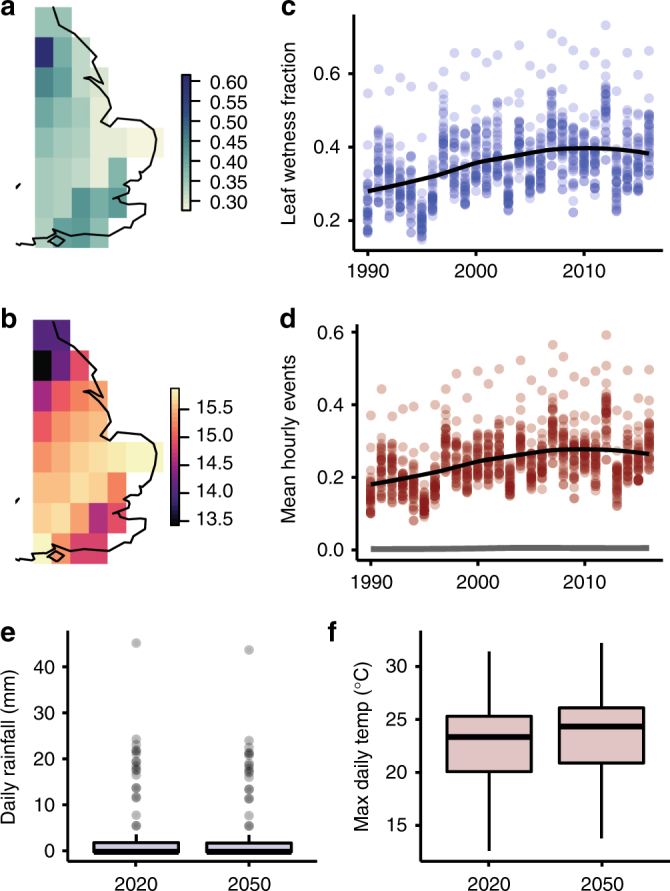
Fig. 4.

Weather-driven risk model indicates increasingly conducive conditions for fungal pathogen growth over the past 25 years. a Mean leaf wetness fraction, 1990–2016, Japanese 55-year Reanalysis (JRA55). Values are the fraction of hours during the summer when canopy surface moisture was above zero. b Mean canopy temperature, 1990–2016, JRA55. Values are canopy temperature during summer months when the JRA55 canopy moisture fraction was above zero. c Annual leaf wetness fraction, 1990–2016. Each point is the mean per pixel. The curve is a loess fit. d Annual mean hourly appressorium formations, 1990–2016. Each point is the mean per pixel, with the model assuming a new cohort of spores deposited in each hour. The black curve is a loess fit. The grey curve is the loess fit to the modeled mean hourly leaf penetrations, values of which were approximately one tenth of the appressorium formations. e Daily rainfall distributions, 2020 vs. 2050. Values represent summer days from 99 runs of the MarkSim daily weather generator for 17 CMIP GCMs, for a point near Cambridge. f Daily maximum temperature, 2020 vs. 2050. Values derived as in e
