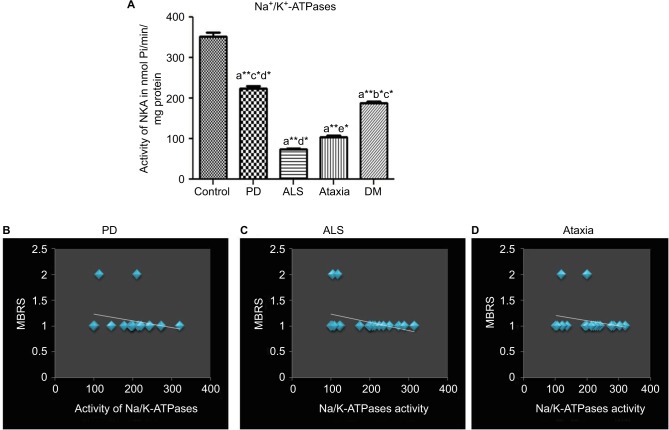
Figure 1.
(A) The representative histogram of the activity of NKA activity of control and the recruited neurodegenerative subjects. ANOVA was performed (p≤0.05) compared with (a) control, (b) Parkinson’s disease, (c) amyotrophic lateral sclerosis, (d) ataxia and (e) dementia. Error bars indicate SEM; (B) data on the linear correlation analysis between MBRS and Parkinson’s disease; (C) data on the linear correlation analysis between MBRS and amyotrophic lateral sclerosis; (D) data on the linear correlation analysis between MBRS and ataxia. Nonparametric correlation (Spearman’s rho, r) was used to correlate clinical features (movement dysfunction in accordance with MBRS and age) and NKA activity in ND subjects with movement disorders; *p≤0.05 indicates significance; **p≤0.01 indicates highly significant.
Abbreviations: ANOVA, analysis of variance; PD, Parkinson’s disease; ALS, amyotrophic lateral sclerosis; DM, dementia; SEM, standard error of the mean; MBRS, Modified Bradykinesia Rating Scale; NKA, Na+/K+-ATPase; ND, neurogenerative disorder.

