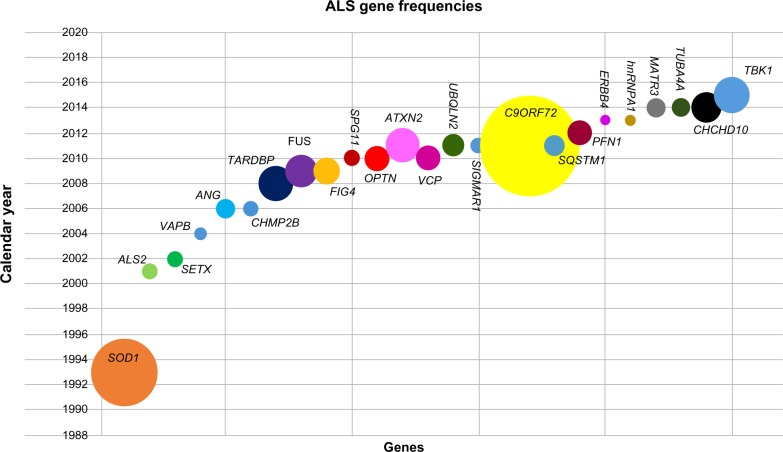
Figure 1.
Gene frequencies in ALS.
Notes: Each gene is plotted against the year it was found; the size of the circles signifies the frequency of mutations in FALS or ALS as cited in the literature. Where gene frequencies were not available, these have been given a circle size equivalent to 1%, for illustrative purposes.
Abbreviations: ALS, amyotrophic lateral sclerosis; FALS, familial ALS.

