
Figure 2.
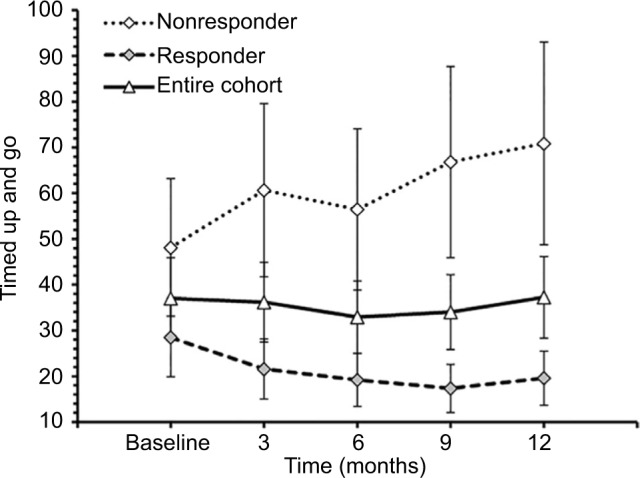
Time to complete timed up and go test at baseline, 3, 6, 9, and 12 months of the entire cohort (n=20), responders (n=10) and nonresponders (n=10).
Note: Values are mean ± standard error.
Official websites use .gov
A
.gov website belongs to an official
government organization in the United States.
Secure .gov websites use HTTPS
A lock (
) or https:// means you've safely
connected to the .gov website. Share sensitive
information only on official, secure websites.
Time to complete timed up and go test at baseline, 3, 6, 9, and 12 months of the entire cohort (n=20), responders (n=10) and nonresponders (n=10).
Note: Values are mean ± standard error.