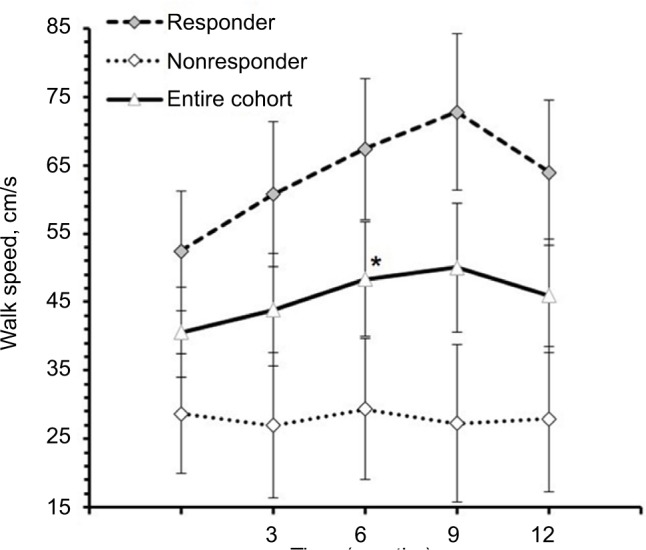
Figure 4.

Speed to walk toward 10 feet mark during timed up and go test at baseline, 3, 6, 9, and 12 months of the entire cohort (n=20), responders (n=10) and nonresponders (n=10).
Notes: Values are mean ± standard error. *p=0.041, significant difference from baseline for entire cohort.
