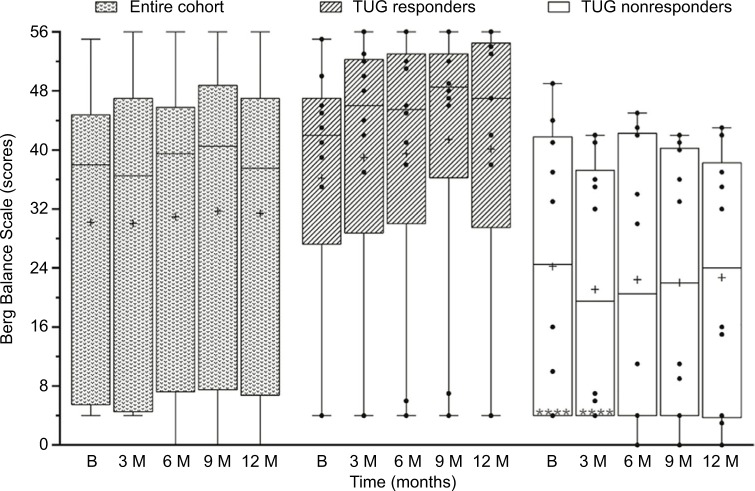
Figure 5.
Berg Balance Scale scores of the entire cohort (n=20), and responders (n=10) and nonresponders (n=10) to TUG test at baseline (B), 3, 6, 9, and 12 months.
Notes: Upper and lower borders of the boxes represent 25th and 75th percentiles, respectively. The line within the boxes represents median and + sign represents mean. The whisker error bars show minimum and maximum values. **** represent lower quartile values overlapping with minimum values. Each black symbol represents individual subject’s score.
Abbreviation: TUG, timed up and go.

