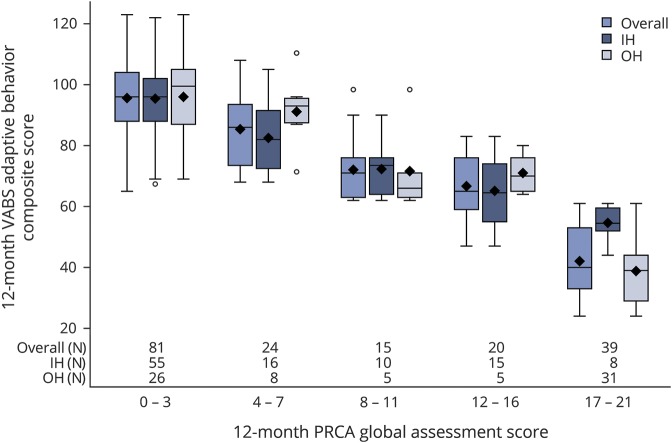
Figure 1. Relationship of 12-month Pediatric Resuscitation after Cardiac Arrest (PRCA) and Vineland Adaptive Behavior Scales, Second Edition (VABS-II) scores.
Data demonstrate a strong relationship between month 12 VABS-II composite score (mean 100, SD 15) on the Y axis and global PRCA score (range 0–21), divided into 5 strata of severity, on the X axis (r = −0.877, p < 0.0001, Pearson correlation coefficient). Data are presented for all cases (left bar), in-hospital (IH) (middle bar), and out-of-hospital (OH) (right bar) groups, as box and whisker plots. Number of patients is shown along the X axis in each group for each stratum. Each shaded box represents the interquartile range (IQR) (middle one-half of the data), the horizontal line within the box is the median, and symbols (◇) are means; upper and lower whiskers represent the maximum and minimum values, excluding outliers (defined as data points more than 1.5 IQRs from the box).

