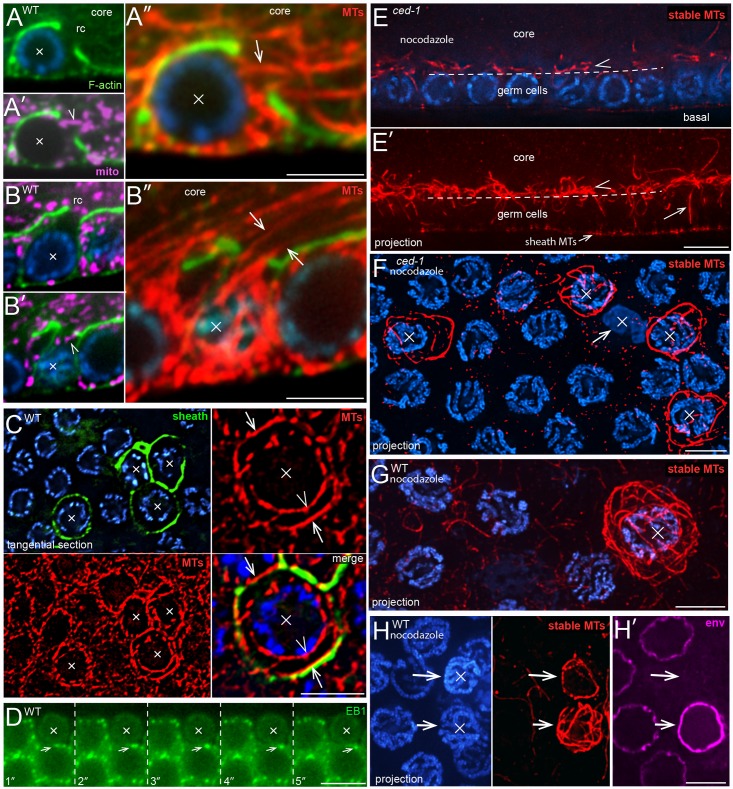
Fig 4. MT cytoskeleton during germ cell apoptosis.
(A,B) Apoptotic cells (X) showing the MT cytoskeleton during mitochondrial exit. Both cells appear shrunken relative to neighboring cells, but both cells have open ring channels and a few mitochondria (magenta, ATP synthase beta). (A-A”) The arrowhead in panel A’ indicates a mitochondrion that appears to be exiting the apoptotic cell. Panel A” shows a high magnification of MTs (arrow) in the same focal plane. The position of this apoptotic cell is indicated in the gonad diagram in Fig 1A by the nucleus with a bold outline. Cells at this position have fewer neighbors than more distal germ cells, which simplifies the identification and tracing of single MTs associated with the cell. From 124 gonads examined, a total of three cells at this position were identified as apoptotic, and all had MTs emerging from the ring channel as shown. (B-B”) Panel B shows a focal plane through the nucleus of the apoptotic cell, and panels B’ and B” show the cortex of the same cell. (C) Wild-type gonad containing apoptotic cells (X), as indicated by their engulfment by a sheath cell reporter (green, CED-1::GFP). In the tangential optical plane shown, MTs in normal cells appear in cross section as small dots (see also Fig 1C). Note that many MTs in the apoptotic cells are parallel with the optical plane (arrows and arrowheads), and thus orthogonal to MTs in normal cells. Some of the MTs in the apoptotic cells appear closely associated with the nuclear envelope (arrowhead), while others are in the cortex (arrows). (D) Video sequence of EBP-1::GFP comets in a ced-1(e1735) gonad. The arrow tracks a comet in a non-apoptotic cell that is adjacent to an apoptotic cell (X). Note that the apoptotic cell has no visible comets. (E) Longitudinal optical section through a nocodazole-treated ced-1(e1735) mutant gonad; panel E’ shows a 5 micron projection of the same region. The dashed line indicates the boundary between the germ cells and the gonad core (compare with Fig 1A). A few, radially aligned MTs (arrow in panel E’) persist in germ cells after nocodazole treatment, but most are depolymerized. By contrast, there are numerous stable, nocodazole-resistant MTs that line the gonad core, outside of the germ cells (arrowhead). (F-H) Tangential planes of a nocodazole-treated ced-1 gonad (panel F) and wild-type gonads (panels G and H). All MT panels show 3 micron projections, revealing most of the MTs in the cell. All of the ced-1 apoptotic cells show a cage or cocoon-like array of stable MTs, except for a cell that appears necrotic (arrow in panel F). Engulfed wild-type apoptotic cells vary in their number of MTs (panel H): The apoptotic cell at top has compacted chromatin, few MTs, and lacks at least one nuclear epitope (magenta, NPP-9), suggesting that it has begun to degrade. Bars = 2.5 microns (A-C, F-H), 5 microns (D, E). Fluorescent reporter: (D) OD1359.

