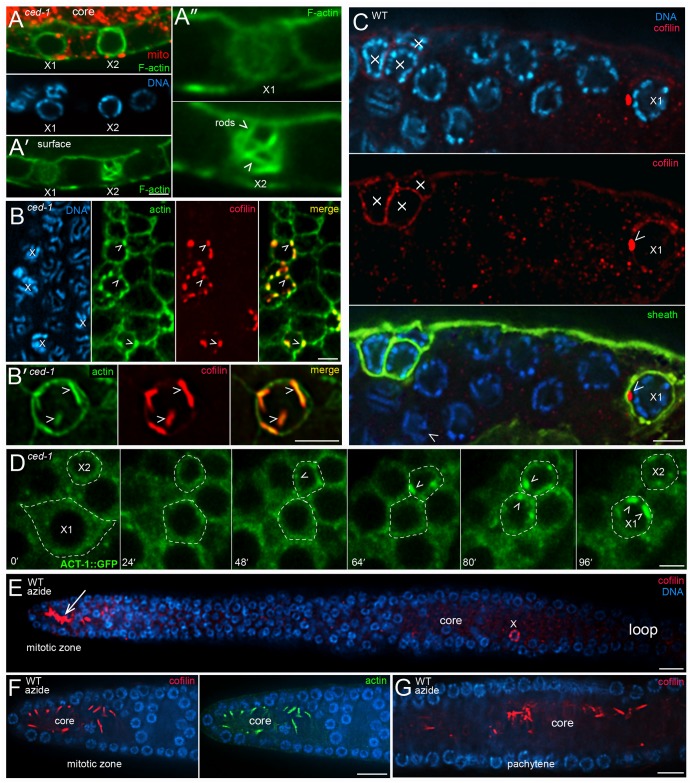
Fig 6. Cofilin-actin rods in apoptotic germ cells.
(A) ced-1(e1735) mutant gonad stained for F-actin (green, phalloidin) and immunostained for mitochondria (red, ATP synthase beta). The image shows two apoptotic cells (X1 and X2) that are fully shrunken, closed, and lack mitochondria. X1 has little or no chromatin compaction, and thus appears younger than X2. However, the level of F-actin staining at the periphery of X2 is higher than X1, suggesting that the level of actin continues to increase after cell shrinkage and closure. Panel A’ shows an optical plane taken at the surfaces of the cells, and panel A” shows higher magnifications of these surfaces. Note that the actin in the older apoptotic cell, X2, appears concentrated in multiple, rod-like structures. (B) ced-1 mutant gonads immunostained for actin (green, anti-actin) and cofilin (red, anti-UNC-60A); examples of cofilin-actin rods are indicated by arrowheads. Panel B’ is a higher magnification, surface view of a single apoptotic cell. (C) Wild-type gonad immunostained for cofilin (red, anti-UNC-60/cofilin) and sheath-specific GFP (green, CED-1::GFP). Four apoptotic cells are visible, as indicated by their engulfment by a sheath cell. The apoptotic cell labeled X1 has a single, prominent cofilin-actin rod (arrowhead). The apoptotic cells at left lack obvious rods, but appear to have higher levels of cytoplasmic cofilin than neighboring, non-apoptotic cells. (D) Video sequence of a live, ced-1(e1735) gonad expressing a transgenic reporter for actin (ACT-1::GFP). Two apoptotic cells (X1 and X2) are visible; X2 has completed shrinkage at the first timepoint, and X1 completes shrinkage at about 48 mins. Cofilin-actin rods (arrowheads) begin to form in X2 at about 48 mins, and in X1 at about 80 mins; X1 shifted below the focal plane at t = 96 mins. (E) Azide-treated, wild-type gonad, immunostained for cofilin (red, anti-UNC-60A). The apoptotic cell (X) contains rods, as in untreated gonads, but azide has induced rod formation in the gonad core in the mitotic region. The lower panels show confocal images of rods induced in mitotic region (panel F) and the pachytene region (panel G). Note that the induced rods form in the gonad core, and not within germ cells. Rod induction in the mitotic region was observed in the following gonads after exposures to 20 mM and 50 mM azide: 2 hrs azide (0/12, 2/32 gonads), 3 hrs (3/16, 30/36), 4 hrs (2/9, 1/35), 5 hrs (4/9, 7/31), 6 hrs (1/15, 1/30), 7 hrs (4/9, 2/25), 8 hrs (0/24, 0/24). Rod induction was observed in the pachytene region after a 3 hr treatment with azide (1/16, 2/36). No cofilin-actin rods were induced in gonads treated with 10 mM azide for 30 mins, 1 hr, and 2 hrs (n = 12–22 gonads, each). About 30% of animals treated for 8 hrs with 50 mM azide recovered some locomotion after removal from azide. Bars = 2.5 microns (A-D), 5 microns (E). Fluorescent reporters: (C) MD701, (D) JJ1477.

