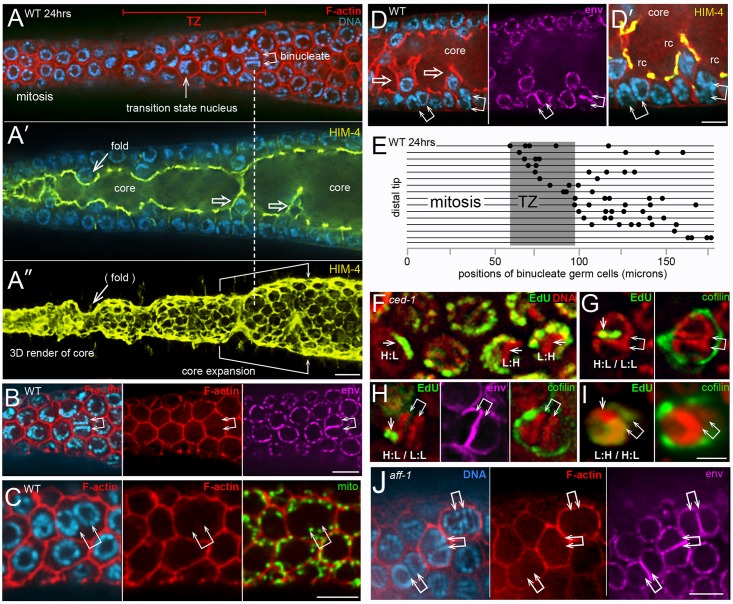
Fig 11. Origin of binucleate cells.
(A-A”) Distal end of wild-type gonad stained for F-actin (red), HIM-4 (yellow), and DNA (blue). The chromatin in an interphase mitotic nucleus forms a symmetrical sphere around the large, central nucleolus. Chromatin in a transition state (TZ) nucleus has an asymmetric, crescent shape, caused by chromosomes pairing. Panel A shows a binucleate germ cell (double arrow) next to the transition zone; note that both nuclei in the binucleate cell resemble transition state nuclei. Panel A’ shows an optical section through the middle of the same gonad; note the enrichment of HIM-4 at the periphery of the gonad core (see also diagram in Fig 1D). Panel A” is a 3D rendered view of an optical stack through the gonad core; the ring channels appear as small ovals on the surface of the core. Note that the ring channel of the binucleate cell (dashed vertical line) is larger than in surrounding germ cells. Although most germ cells contact the periphery of the gonad, several appear folded into the gonad core (open arrows in panel A’). The folding pattern can be inferred from the 3D rendered view of the core, where grooves or depressions in the core correspond to folds. Note that the gonad core expands significantly as the folds disappear. (B-D) Each row of panels shows distal binucleate cells lacking features of apoptotic cells as follows: They have normal levels of peripheral F-actin (panel B), they contain mitochondria (panel C), and they have open ring channels (panel D). Note in panel D that both binucleate cells (double arrows) are at the bases of small folds (open arrows). (E) Map showing the positions of binucleate, non-apoptotic cells (dots) in the distal gonad; each horizontal bar represents one gonad. Importantly, binucleate cells could be distinguished easily from mitotic germ cells in anaphase or telophase (S8 Fig). (F-I) Each set of panels shows EdU (green) that was incorporated into replicated DNA (red). Panel F shows a ced-1(e1735) gonad fixed and stained immediately after 45 mins of labeling. Germ nuclei show H:L or L:H patterns as indicated and described in the text; paired X chromosomes are indicated by an arrow. Panels G-I show binucleate apoptotic cells (indicated by cofilin-actin rods) 20 hours after a pulse of EdU. Note that the two nuclei in a binucleate cell have different labeling patterns, as indicated. (J) Binucleate germ cells in an aff-1(tm2214) mutant gonad. Bars = 5 microns (A-E), 2.5 microns (F-I).

