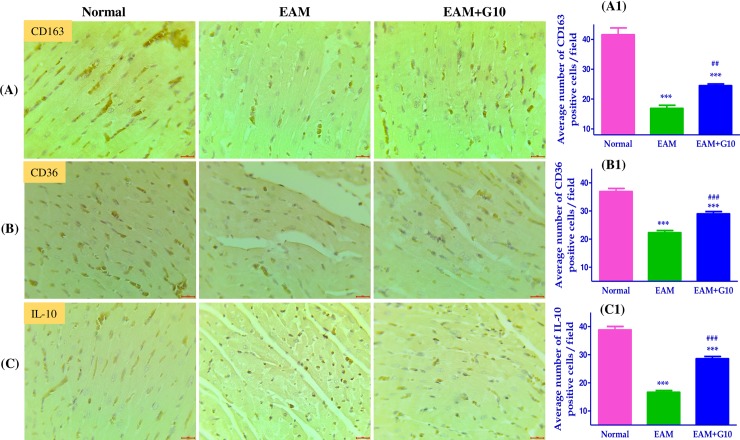
Fig 6. Effect of gallein on M2-like macrophage phenotype in the heart of EAM rats.
IHC staining for (A-A1) CD163, (B-B1) CD36, (C-C1) IL-10 and their quantification data. Scale bar = 20 μm. Each bar represents mean ± SEM, n = 4–5. Normal, age matched normal rats; EAM, rats with experimental autoimmune myocarditis treated with vehicle; EAM+G10, rats with EAM treated with gallein. ***p<0.001 vs Normal; ###p<0.001 and ##p<0.01 vs EAM.

