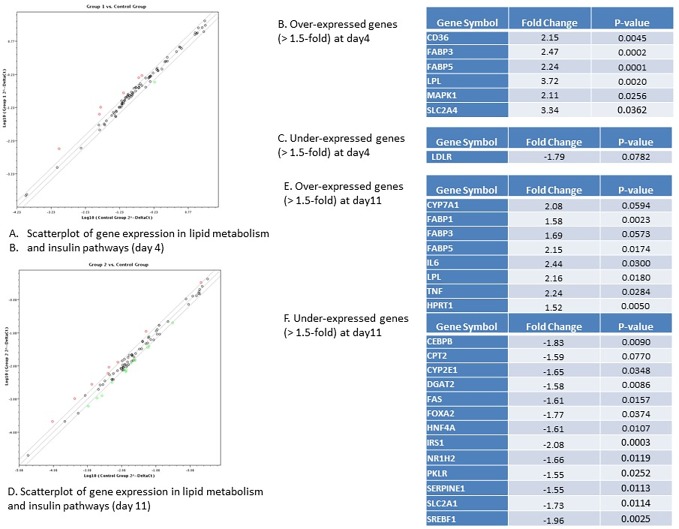
Fig 8. Key genes in lipid metabolism and insulin signaling pathways differentially expressed in liver organoids with miR-122 inhibition vs control organoids.
A. Scatterplot of gene expression in lipid metabolism and insulin signaling pathway in miR-122 inhibited organoids after 4 days (group 1) vs control organoids infected with control lentivirus after 4 days (control group). Over-expressed genes are depicted in red while under-expressed genes depicted in green. B. Over-expressed genes (>1.5 fold) at day 4 post-infection. C. Under-expressed genes (<1.5 fold) at day 4 post-infection. D. Scatterplot of gene expression in lipid metabolism and insulin signaling pathway in miR-122 inhibited organoids after 11 days (group 2) vs control organoids infected with control lentivirus after 11 days (control group). Over-expressed genes are depicted in red while under-expressed genes depicted in green. B. Over-expressed genes (>1.5 fold) at day 11 post-infection. C. Under-expressed genes (<1.5 fold) at day 11 post-infection.

