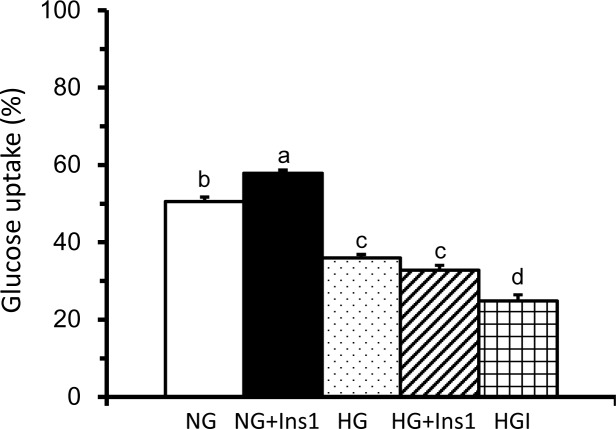
Fig 1. Glucose uptake of HepG2 cells in the NG, HG and HGI models with or without insulin stimulation.
Cells were incubated in DMEM with 5.5 mM glucose, 33 mM glucose, or 33 mM glucose plus 10−7 M insulin for 24 hr followed by 0 (NG model and HG model) or 10−7 M insulin stimulation (NG model+Ins1, HG model+Ins1 and HGI model) for 1 hr. Glucose uptake was determined by flow cytometer as the percentages of HepG2 cells absorbed with fluorescently-labeled 2-NBDG without propidium iodide (PI). The percentages of glucose uptake in the NG model without any stimulation was adjusted to approximately 50% of cells absorbed 2-NBDG without PI. To compare the glucose uptake of different models with the NG model, the voltage setting of flow cytometer was consistent. Values are means ± SEM, n = 9 for each group. Values with completely different lowercase superscript letters indicate significant differences among the models (one-way ANOVA with LSD, P < .05).

