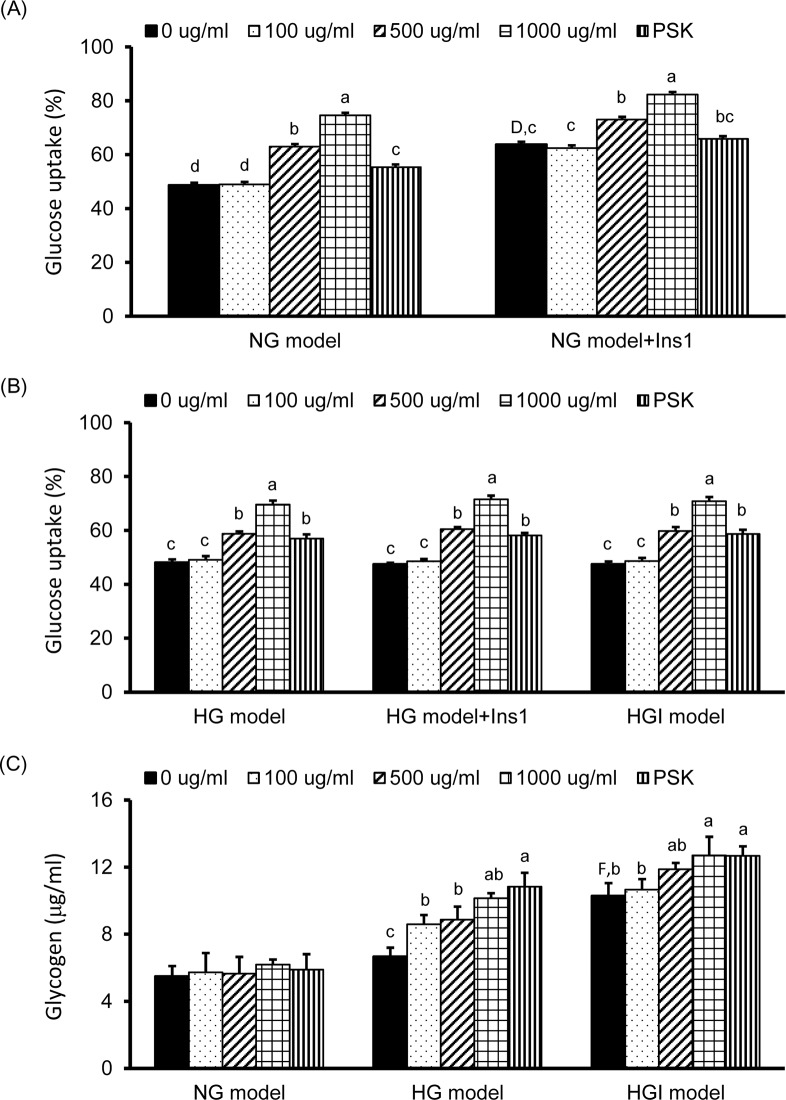
Fig 2. Glucose uptake and glycogen storage of HepG2 cells with TV LH-1 ePSP, PSK or insulin treatment.
Glucose uptake (A and B) and glycogen storage (C) of HepG2 cells incubated in DMEM with 5.5 mM glucose (NG model), 33 mM glucose (HG model), or 33 mM glucose plus 10−7 M insulin (HGI model) and treated with TV LH-1 ePSP (0, 100, 500, or 1000 μg/ml) or PSK (1000 μg/ml) for 24 hr followed by 0 or 10−7 M insulin treatment for 1 hr. Glucose uptake was determined by flow cytometer as the percentages of HepG2 cells absorbed with fluorescently-labeled 2-NBDG without propidium iodide (PI) as described in the Methods and Materials section. Values are means ± SEM, n = 12 for each group. Values with uppercase superscript letters D and F indicated that the NG model+ins1 and HGI model with no treatment (i.e., 0 μg/ml) were significantly different from the NG model (0 μg/ml); and those with different lowercase superscript letters indicate significant differences within each model (one-way ANOVA with LSD, P < .05).

