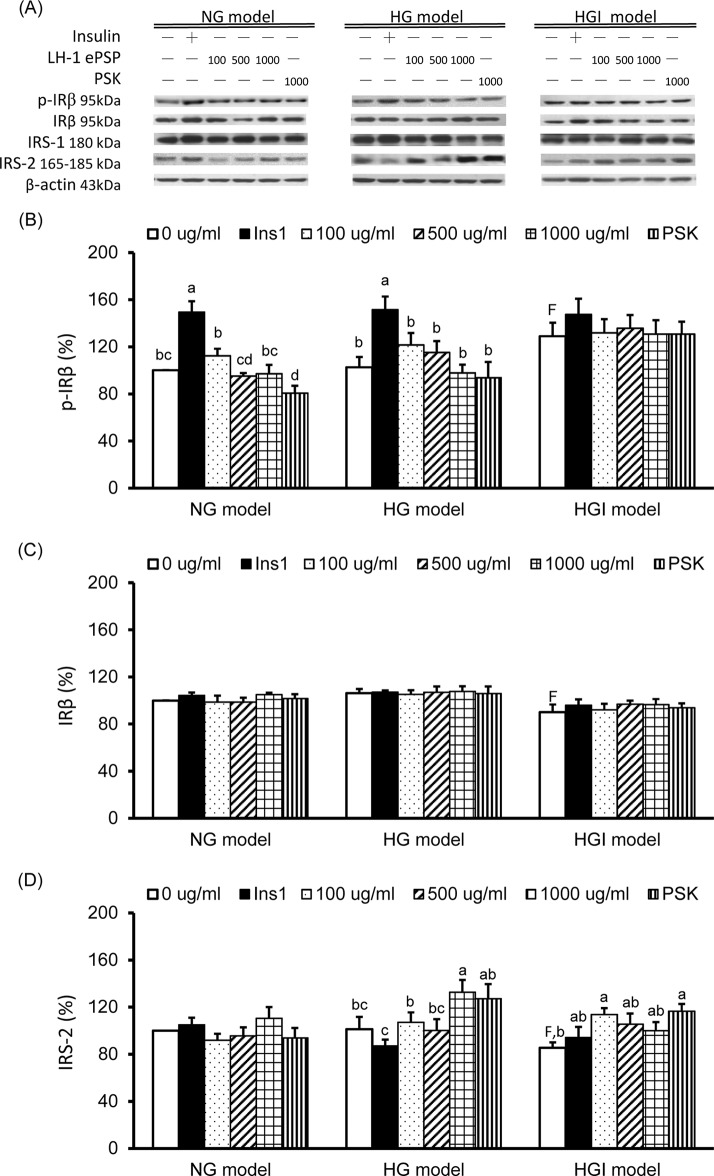
Fig 3. Protein expression of insulin receptor and insulin receptor substrates.
Western blot analysis was used to detect phosphorylated insulin receptor (p-IR) b, total IRb, insulin receptor substrate (IRS) 1 and 2, and the internal control β-actin (A). Protein expression of p-IRb (B), total IRb (C) and IRS2 (D). Protein quantification was carried out by densitometric analysis, normalized by the internal control β-actin, and calculated as the percentages of the NG model without any treatment (0 μg/ml). Values are means ± SEM, n = 9 for each group. Values with uppercase superscript letter F indicated that the HGI model with no treatment (i.e., 0 μg/ml) was significantly different from the NG model (0 μg/ml); and those with different lowercase superscript letters indicate significant differences within each model (one-way ANOVA with LSD, P < .05).

