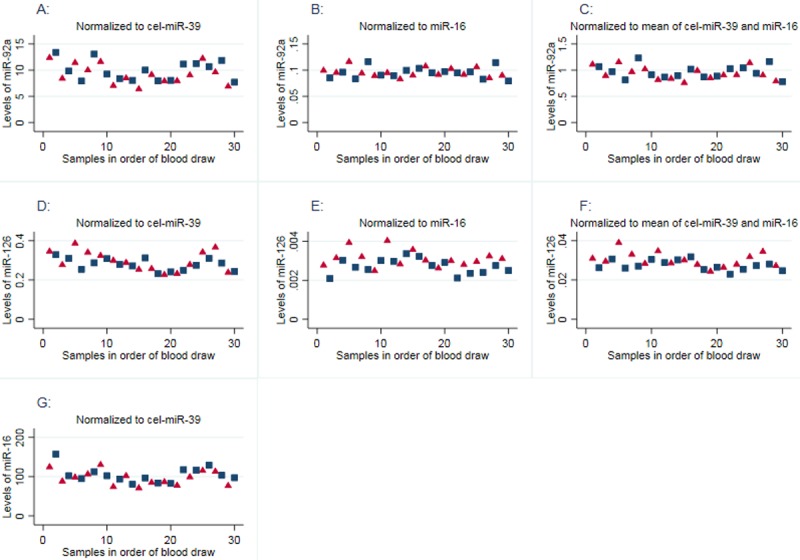
Fig 2. Relative microRNA levels and order of blood draw.

Plots showing the relative microRNA levels in 30 PPP samples from a healthy volunteer in order of blood draw. Samples with odd numbers were prepared by dual centrifugation (red triangles) and samples with even numbers by a prolonged single centrifugation (blue squares). MicroRNA-levels were normalized to cel-miR-39 (plots A, D and G), miR-16 (plots B and E) or the mean of cel-miR-39 and miR-16 (plots C and F). In all cases, we found no significant differences (t-test) in the mean microRNA-levels between the first 10 tubes and the last 10 tubes drawn (p>0.05).
