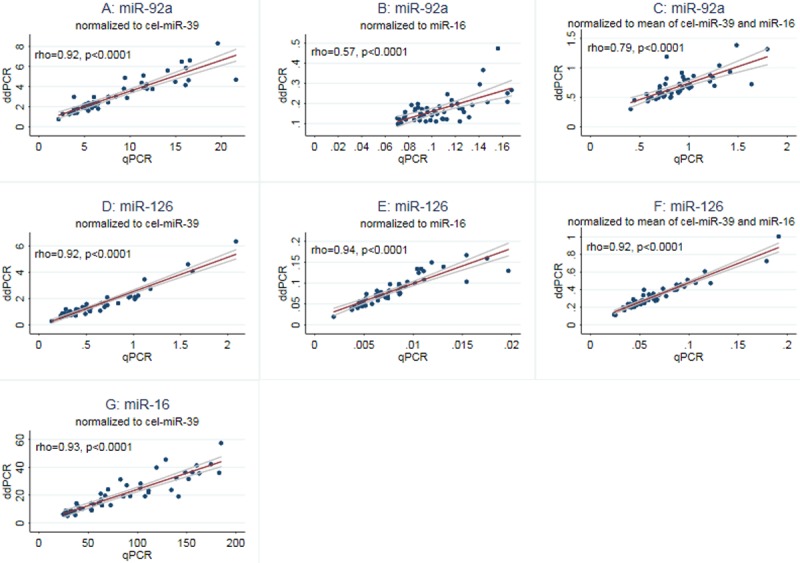
Fig 3. Correlation of measurements obtained by qPCR and ddPCR.

Plots showing the correlation (with 95% confidence interval) between microRNA quantification performed by single TaqMan assays (= qPCR) and ddPCR. In plot A, D and G the target microRNAs are normalized to cel-miR-39, in plot B and E miR-16 was used for normalization, and in plot C and F data were normalized to the mean of cel-miR-39 and miR-16.
