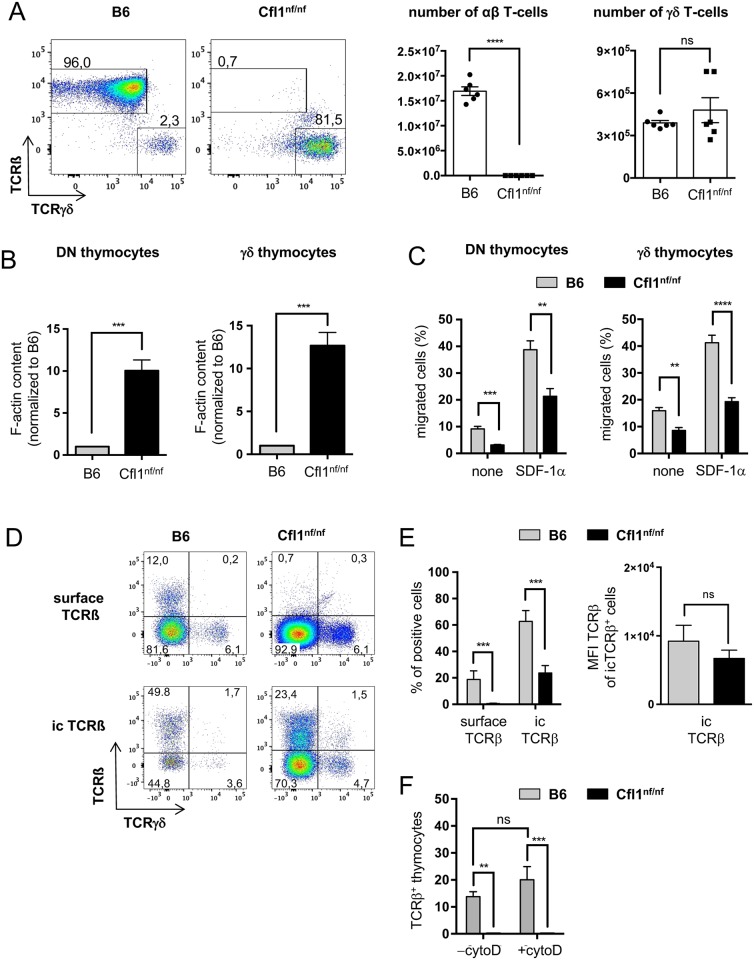
Fig 3. DN thymocytes of Cfl1nf/nf mice show a dramatically enhanced F-actin content and impaired migratory capacity as well as a lack of TCRβ surface expression.
(A) CD3+ splenocytes were analyzed for expression of TCRβ and TCRγδ. Shown are representative dot blots (left panels) and calculated absolute cell numbers (right panel) of TCRβ and TCRγδ expressing cells. Data is represented as mean ± SEM and summarizes 3 independent experiments with a total of 6 mice per group. (B) Total F-actin amount of DN thymocytes or γδ thymocytes was determined by SiR-actin staining (n = 3 independent experiments with a total ≥6 mice per group). (C) Migratory capacity of DN cells or γδ thymocytes was determined in a transwell assay (pore size 5 μm) in which SDF-1α (200 ng/ml) was used as chemotactic stimulus. Migration was carried out for 3 h (n = 3 independent experiments with ≥4 mice per group). (D) TCRβ surface (surface TCRβ) and intracellular (ic TCRβ) expression was analyzed in DN cells by flow cytometry. Representative dot plots from TCRβ versus TCRγδ staining on B6 and Cfl1nf/nf DN cells are shown (n = 4 independent experiments with a total of ≥7 mice per group). (E) Analysis of surface and ic expression of TCRβ in DN cells of B6 (grey bar) and Cfl1nf/nf mice (black bar) (left bar chart). Analysis of MFI of TCRβ of icTCRβ+ DN cells of B6 (grey bar) and Cfl1nf/nf mice (black bar) (right bar chart). (F) Analysis of surface expression of TCRβ in DN thymocytes of B6 and Cfl1nf/nf mice before (-cytoD) and after cytochalasin D treatment (+cytoD). Data is represented as mean ± SEM. **** p < 0.0001; *** p < 0.001; ** p < 0.01; * p < 0.05; Underlying data can be found in S1 Data. cytoD, cytochalasin D; ic, intracellular; MFI, mean fluorescence intensity nf, nonfunctional; ns, not significant.

