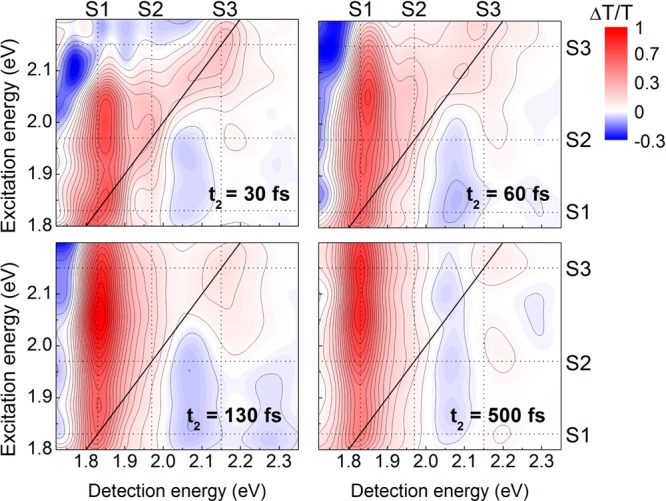
Figure 2.

2DES maps of CdTe NRs at waiting times t2 = 30, 60, 130, and 500 fs. Here red represents positive ΔT/T due to photobleaching and blue signifies negative (photoinduced absorption) signals induced by transition energy shifts.35 The excitation energy scale has been normalized by the pump laser spectrum, absolute color and contour scale is set to the minimum and maximum intensity, and the excitation pulse energy is 1.6 nJ corresponding to a fluence of 5 μJ/cm2. Dotted lines show the positions of the S1, S2, and S3 excitons at excitation and detection energies, while the solid black line shows the diagonal, where excitation and detection have equal energy.
