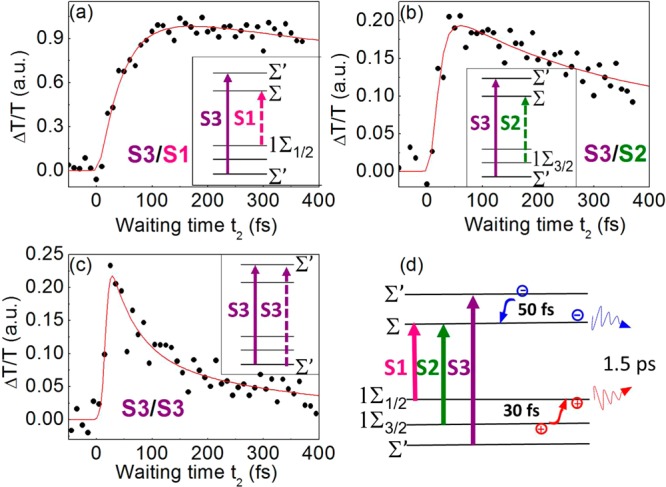
Figure 4.

Experimental data (black points) and fits (red lines) of the ΔT/T signal obtained from the 2DES maps for selected excitation and detection energies, exciting the S3 exciton and detecting at S1 (a), S2 (b), and S3(c), together with the schemes for state relaxation in the insets. A summary of the identified relaxation pathways and respective time scales is shown in panel d.
