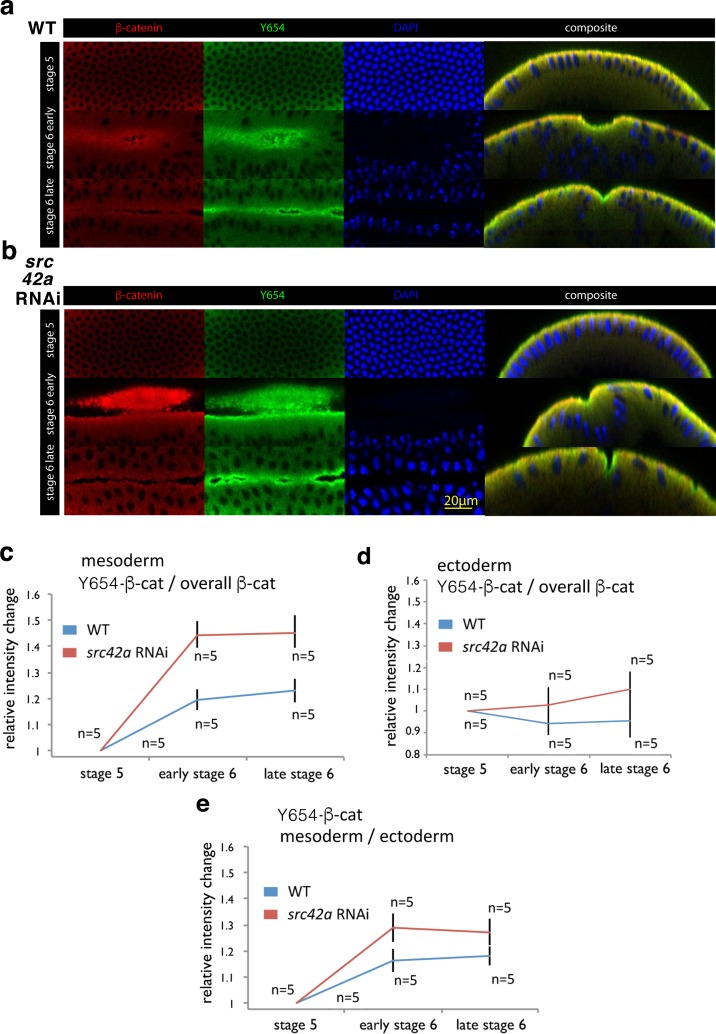
Figure 4. Increase of accessibility of Y654-β-cat in the mesoderm during invagination.
(a, b) Fluorescent labelling of wild type (WT) (a) and src42A RNAi (b) embryos at three different stages for β-cat in red, the not phosphorylated tyrosine Y654 of β-cat in green and nuclei in blue (DAPI). Composite are cross-cuts of the 3D reconstructed images of the latter three colour images of the embryo. (c) Relative intensity change of antibody fluorescent signal against the non-phosphorylated non-phosphorylated Y654-β-cat site of Src42A phosphorylation in the mesoderm junctions, normalized to the junctional total β-cat signal, in wild type (WT) and src42A RNAi (Src42A knock down) background condition. Values are relative to stage 5. N = 5 in the WT, and N = 5 in the src42A RNAi. Mean and SEM are shown, t-test p=value 0.00181 and 0.00021 at early stage 6, 0.000508 and 0.00330 at late stage 6 for WT and src42A RNAi, respectively. WT compared to src42A RNAi early stage 6 p=0.00355, late stage 6 p=0.00879, difference between the two curves p=0.0003. (d) Relative intensity change of antibody fluorescent signal against the non-phosphorylated Y654-β-cat site of Src42A phosphorylation in the ectoderm junctions, normalized to the junctional total β-cat signal, in wild type (WT) and src42A RNAi (Src42A knock down) background condition. Values are relative to stage 5. N = 5 in the WT, and N = 5 in the src42A RNAi. Mean and SEM are shown, t-test p=value of 0.439 and 0.738 at early stage 6, of 0.578 and 0.347 at late stage 6 for WT and src42A RNAi, respectively. WT compared to src42A RNAi early stage 6 p=0.247, late stage 6 p=0.162, difference between the two curves p=0.169. (e) Relative intensity change of the non-phosphorylated Y654-β-cat site of the mesoderm signal to the non-phosphorylated Y654-β-cat ectoderm signal within the same embryos. Mean and SEM are shown, t-test p=value 0.0103 and 0.000278 at early stage 6, 0.0125 and 0.00256 at late stage six for WT and src42A RNAi, respectively. WT compared to src42A RNAi early stage 6 p=0.049, late stage 6 p=0.063, difference between the two curves p=0.021.

