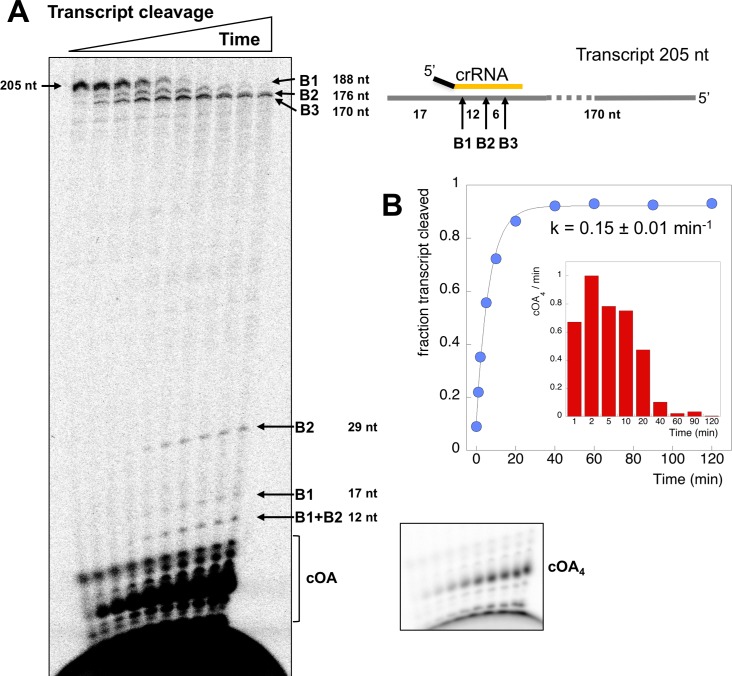
Figure 4. Csm transcript cleavage and cOA production.
(A) Denaturing gel electrophoresis showing cleavage of a 205 nt RNA tanscript target by Csm over time, and cOA synthesis. Products arising from cleavage at sites B1-B3 are indicated. Lanes 1–10 represent time points of 0, 1, 2, 5, 10, 20, 40, 60, 90, 120 min. (B) Quantification of the fraction of cleaved transcript against time, fitted to an exponential equation, yielded a rate of 0.15 min−1. A bar chart showing the change in cOA4 production per minute for each time period (normalised to the value at 2 min) is shown as an insert.

