. 2018 Jul 10;7:e35788. doi: 10.7554/eLife.35788

Figure 1. General features of promoter interactions.

(A) Venn diagram displaying the number of cell-type-specific and shared promoter interactions in each cell type. (B) Proportion of interactions in each distance category: promoter (P)-promoter (both interacting ends overlap a transcription start site (TSS)); P-proximal (non-promoter end overlaps captured region but not the TSS); P-distal (non-promoter end is outside of captured region). Note that all promoter interactions are separated by at least 10 kb. (C) Distribution of the distances spanning each interaction in iPSCs and CMs. The red line depicts the median (170 kb in iPSCs, 164 kb in CMs); the black line depicts the mean (208 kb in iPSCs, 206 kb in CMs). (D) A ~ 2 Mb region of chromosome 8 encompassing the GATA4 gene is shown along with pre-capture (whole genome) Hi-C interaction maps at 40 kb resolution for iPSCs (top) and CMs (bottom). TADs called with TopDom are shown as colored bars (median TAD size = 640 kb in both cell types, mean TAD size = 742 kb in iPSCs and 743 kb in CMs) and significant PCHi-C interactions as colored arcs. (E) Zoomed-in view of the GATA4 locus (promoter highlighted in yellow) in iPSCs (top) and CMs (bottom) along with corresponding RNA-seq data generated as part of this study, and ChIP-seq data for H3K27ac, H3K4me1, H3K27me3 and CTCF from the Epigenome Roadmap Project/ENCODE (H1 and left ventricle for iPSC and CM, respectively). Filtered GATA4 read counts used by CHiCAGO are displayed in blue with the corresponding significant interactions shown as arcs. For clarity, only GATA4 interactions are shown. Gray highlighted regions show interactions overlapping in vivo validated heart enhancers (pink boxes), with representative E11.5 embryos for each enhancer element (Visel et al., 2007). Red arrowhead points to the heart.

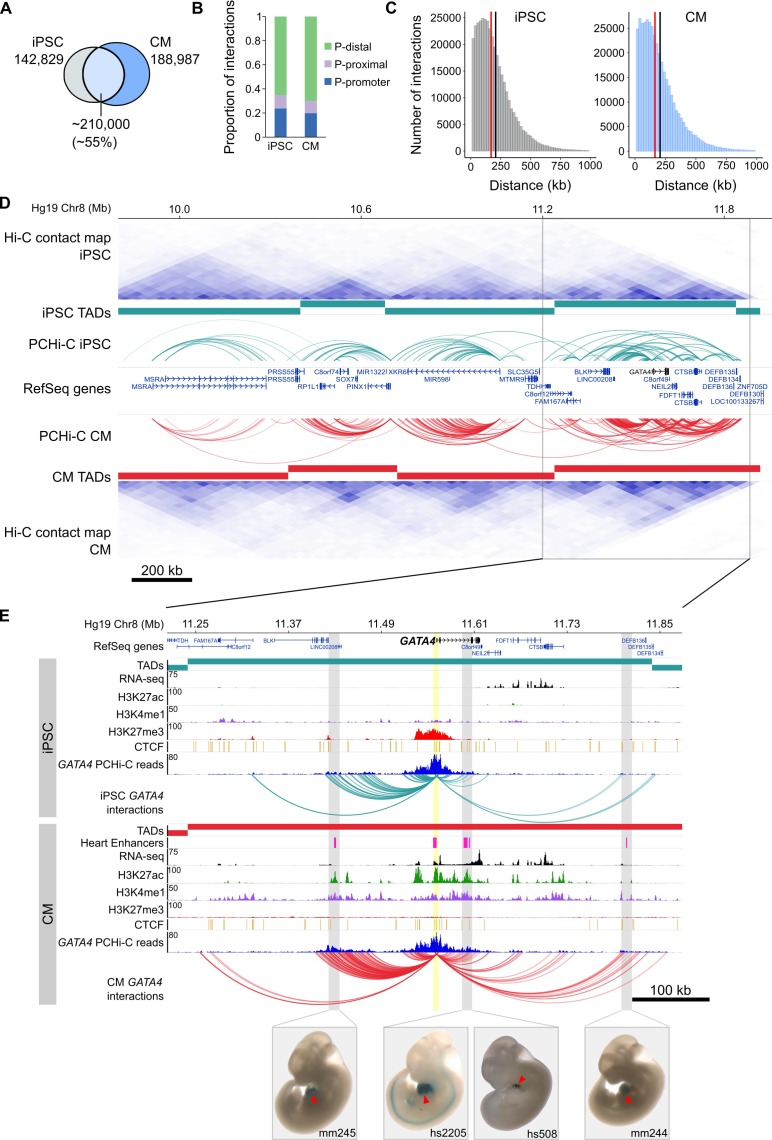
Figure 1.

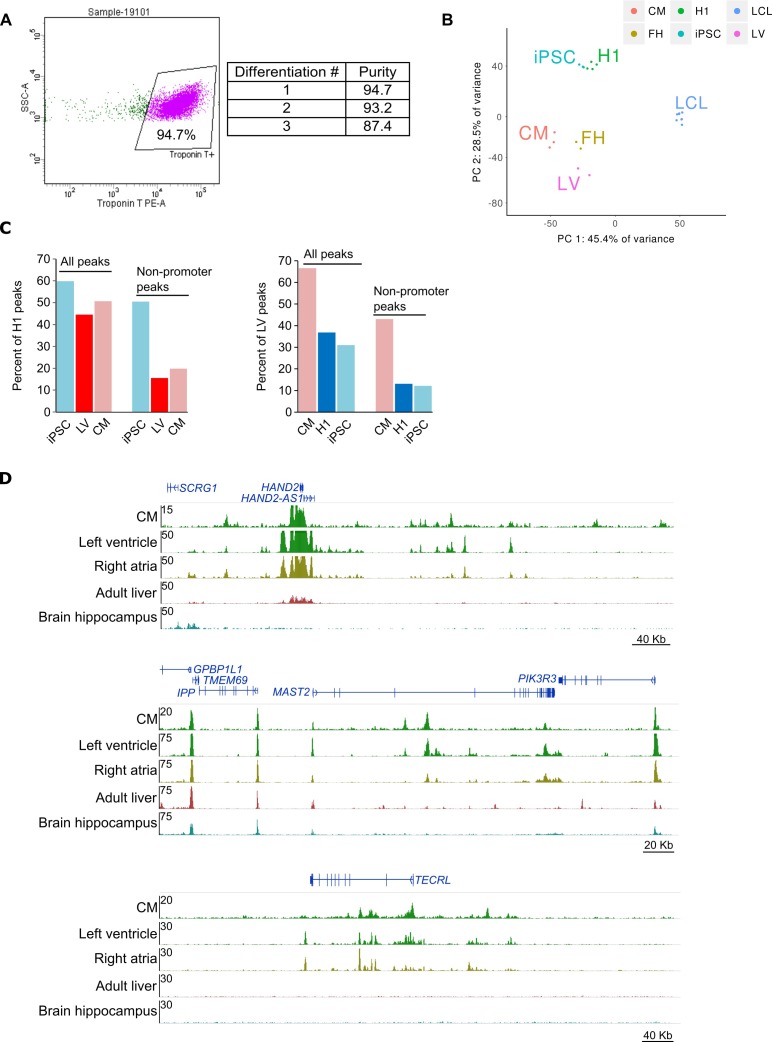
Figure 1—figure supplement 1. Quality control of iPSC-CMs.

Figure 1—figure supplement 1.

(A) Flow cytometry of iPSC-derived cardiomyocytes. Representative image of flow data for cardiomyocytes (left) and percent cardiac troponin T (cTnT) positive for each differentiation (right). Cells were first gated on live/dead and then on cTnT staining. (B) Principle component analysis of RNA-seq data in iPSCs and CMs along with H1 embryonic stem cells, left ventricular cells (LV), fetal heart cells (FH), and lymphoblastoid cell line cells (LCL). LCLs cluster independently from iPSC and CM, indicating that iPSCs were faithfully reprogrammed. (C) Percentage of Epigenome Roadmap H3K27ac ChIP-seq peaks overlapping iPSC and CM H3K27ac peaks. Overlaps for all peaks and only non-promoter peaks are shown. LV, left ventricle; H1, H1 embryonic stem cell line. (D) Three genome browser snap-shots displaying the epigenetic landscape in CMs compared to left ventricle, right atria, adult liver and brain hippocampus from the Epigenome Roadmap.
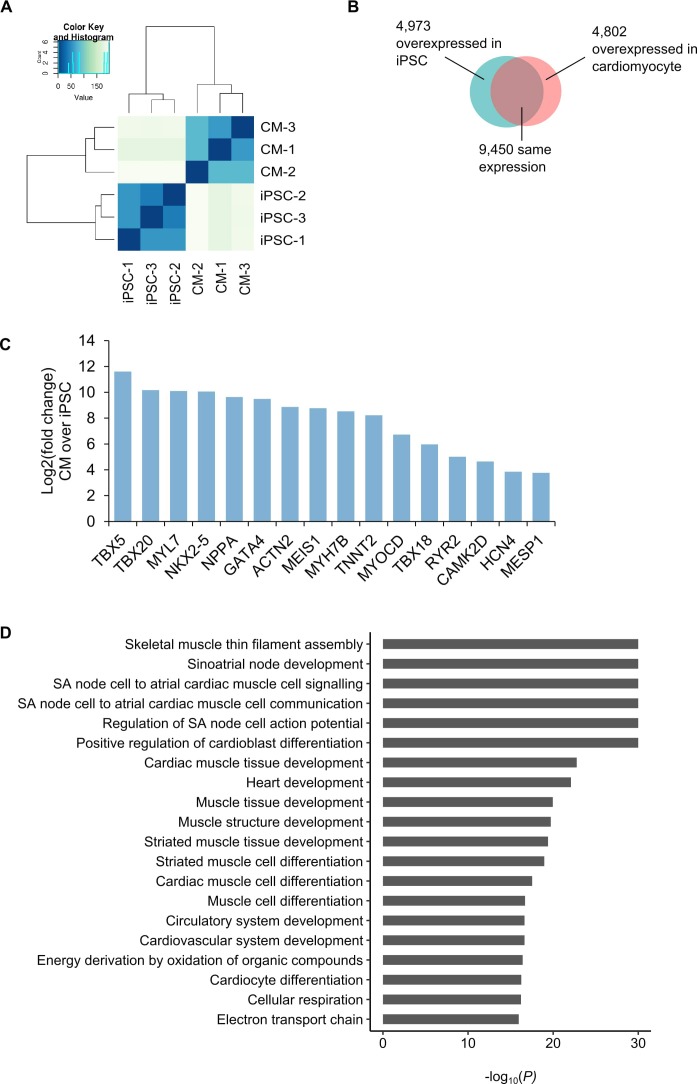
Figure 1—figure supplement 2. Analysis of RNA-seq in iPSCs and iPSC-CMs.

Figure 1—figure supplement 2.

(A) Cluster analysis of RNA-seq data from each triplicate of iPSC and CM. (B) Number of genes differentially expressed in each cell type. (C) Selected genes overexpressed in CMs relative to iPSCs. (D) Gene Ontology enrichment analysis of the biological processes associated with the 4802 genes overexpressed in cardiomyocytes.
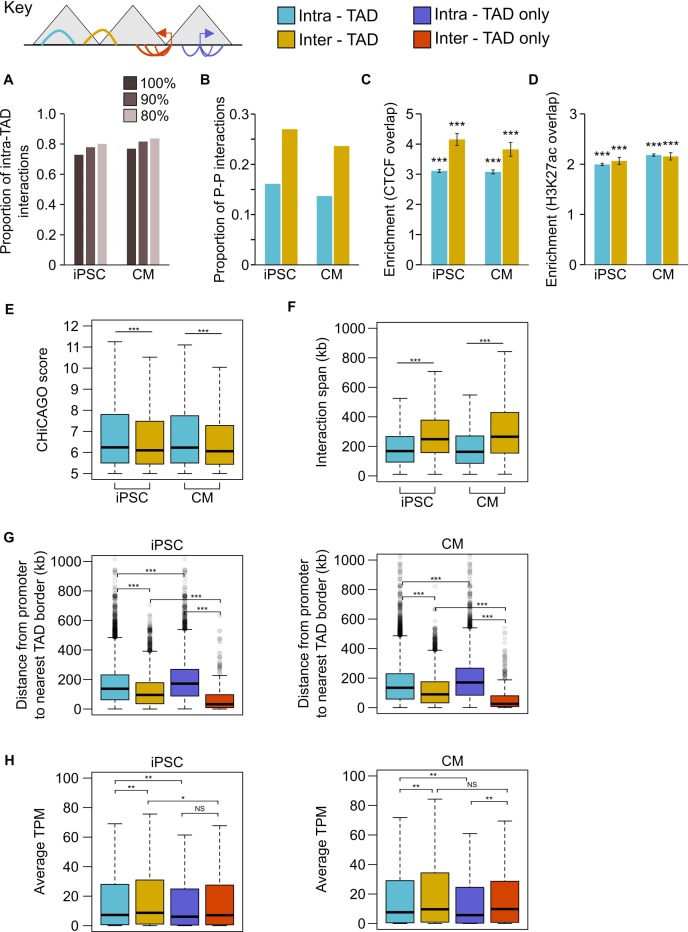
Figure 1—figure supplement 3. Analysis of PCHi-C interactions in the context of TADs.

Figure 1—figure supplement 3.

In this analysis, interactions were classified as intra-TAD (both ends of the interaction fully within a single TAD) or inter-TAD (each end of the interaction is in a different TAD). Interactions falling partially or wholly within TAD ‘boundaries’ or ‘gaps’ as defined by TopDom were omitted (see Materials and methods). (A) Proportion of interactions that are intra-TAD at different cut-offs. All analyses used interactions that were 100% within a TAD. (B) Proportion of promoter-promoter interactions in the set of intra-TAD and inter-TAD interactions. (C,D) Fold enrichment for intra-TAD and inter-TAD interactions to overlap CTCF (C) or H3K27ac peaks (D). Only promoter-distal ChIP-seq peaks were analyzed. ***p<2.2 × 10−16, Z-test. (E) CHiCAGO score and (F) interaction span of intra- vs. inter-TAD interactions. ***p<2.2 × 10−16, Wilcoxon rank-sum test. (G,H) Considering promoters with an intra-TAD interaction, an inter-TAD interaction, or exclusively intra-TAD or inter-TAD interactions: (G) distance from the promoter TSS to the nearest TAD boundary and (H) average TPM value of the promoter. ***p<2.2 × 10−16, **p<0.01, *p<0.05, NS = not significant, Wilcoxon rank-sum test.