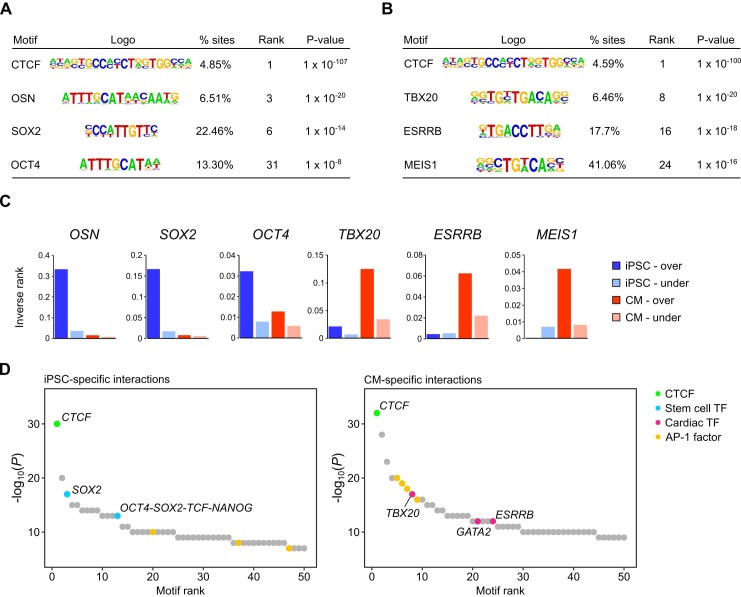
Figure 2. Transcription factor motif enrichment in distal interacting regions.
(A,B) Selected transcription factor (TF) motifs identified using HOMER in the promoter-distal interacting sequences for all over-expressed genes in (A) iPSCs and (B) CMs (fold change > 1.5, Padj < 0.05). ‘% sites’ refers to the percent of distal interactions overlapping the motif; rank is based on p-value significance. (C) To compare motif ranks across gene sets, the inverse of the rank is plotted for selected motifs identified in distal interactions from over- or under-expressed genes in both iPSCs and CMs. (D) The top 50 motifs identified in cell-type-specific interactions. OSN, OCT4-SOX2-TCF-NANOG motif.

