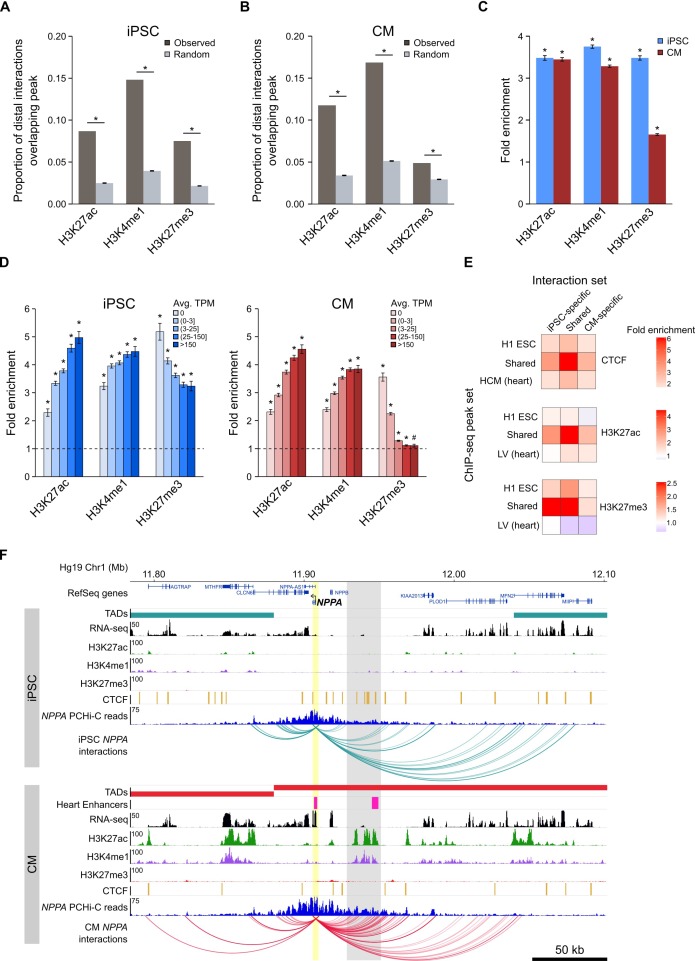
Figure 3. Enrichment of promoter interactions to distal regulatory features.
(A,B) Proportion of promoter-distal interactions overlapping a histone ChIP-seq peak compared to random control MboI fragments (see Materials and methods). iPSC interactions were overlapped with H1 ESC ChIP-seq data; CM interactions were overlapped with left ventricle ChIP-seq data from the Epigenome Roadmap Project (Supplementary file 10). (C) Fold enrichment of the data presented in (A) and (B). (D) Fold enrichment of promoter-distal interactions based on the expression level of the promoter. Promoters were grouped into five bins according to their average TPM values. Dashed line indicates no enrichment. (E) Fold enrichment of cell-type-specific and shared interactions (columns) to tissue-specific and shared chromatin features (rows). (F) Example of the NPPA gene in iPSCs (top) and CMs (bottom). Gray box highlights CM-specific interactions to CM-specific chromatin marks and an in vivo heart enhancer (Visel et al., 2007). For clarity, only interactions for NPPA are shown. *p<0.00001, #p=0.0017, Z-test.


