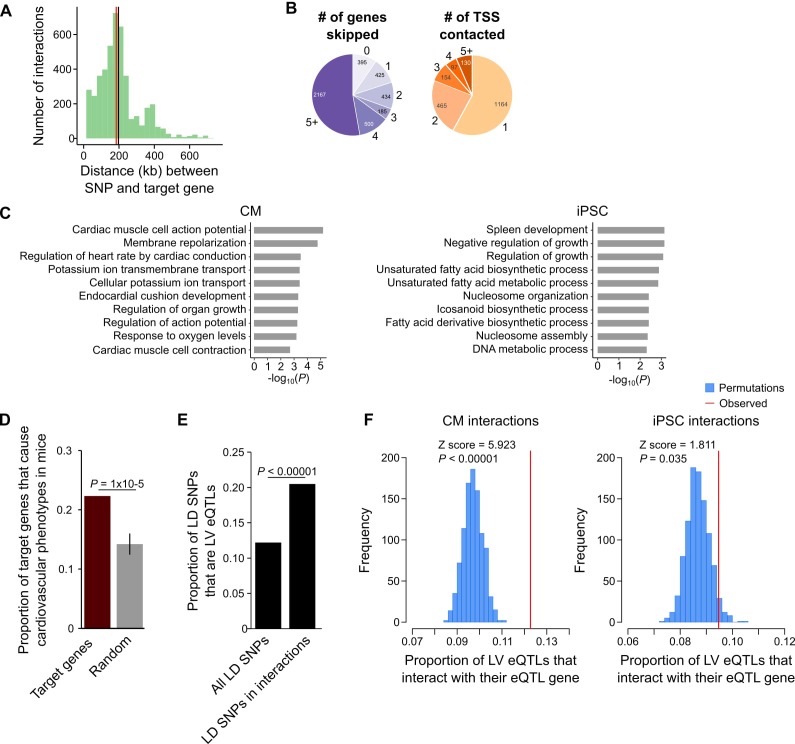
Figure 5. CM promoter interactions link CVD GWAS SNPs to target genes.
(A) Distribution of genomic distances separating SNP-target gene interactions (red line, median = 185 kb; black line, mean = 197 kb). (B) Pie chart showing the number of TSS’s skipped for each SNP-target gene interaction (left) and the number of genes contacted by each SNP (right). (C) GO enrichment analysis for genes looping to LD SNPs using the CM promoter interaction data (left panel) or the iPSC promoter interaction data (right panel). (D) Proportion of target genes that result in a cardiovascular phenotype when knocked-out in the mouse (MGI database [Blake et al., 2017]), compared to a random control set. p-Value calculated with a Z-test. (E) Proportion of GWAS LD SNPs that are eQTLs in left ventricle (LV) when considering either the full set of LD SNPs, or the subset that overlap CM promoter interactions. p-Value calculated with Fisher’s exact test. (F) Proportion of LV eQTLs (genome-wide) that map within a promoter interaction for the eQTL-associated gene (indicated by the red line). Random permutations were obtained by re-assigning each promoter’s set of interactions to a new promoter and calculating the proportion of eQTLs in random interactions that interact with their eQTL-associated gene. Proportions only consider eQTLs that overlap a promoter-distal interaction. P-values calculated with a Z-test.

