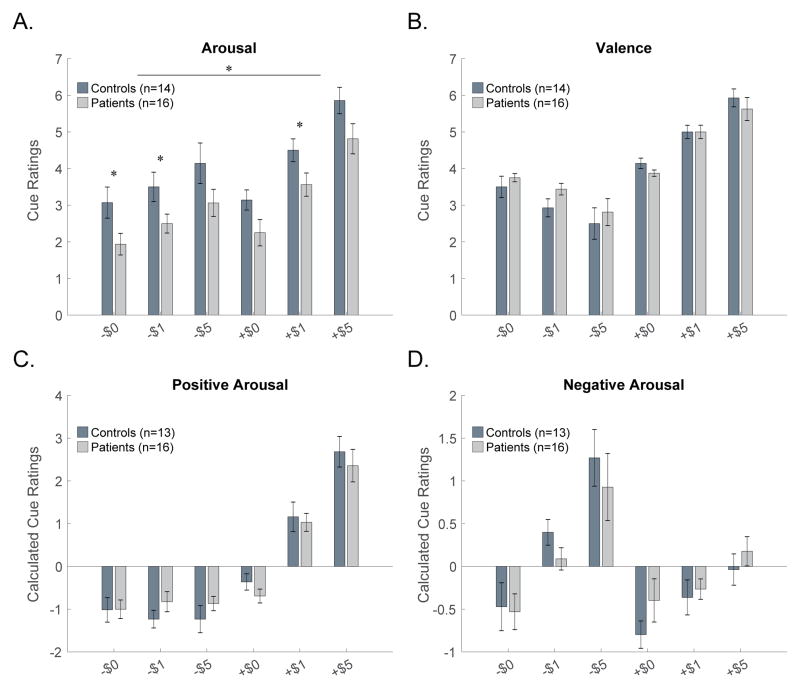
Figure 2. Ratings of Arousal, Valence, Positive Arousal, Negative Arousal.
(A) Across all cues arousal ratings were lower in patients as compared with controls (p = 0.006). Post-hoc t-tests for individual cue between-group differences are marked with asterisks (p<0.05 uncorrected for multiple comparisons). Valence (B), positive arousal (C), and negative arousal (D) ratings were similar in patients and controls. One patient did not provide any ratings, one control subject was missing data for arousal, and a second control subject was missing data for valence; these subjects were excluded from the associated analyses.

