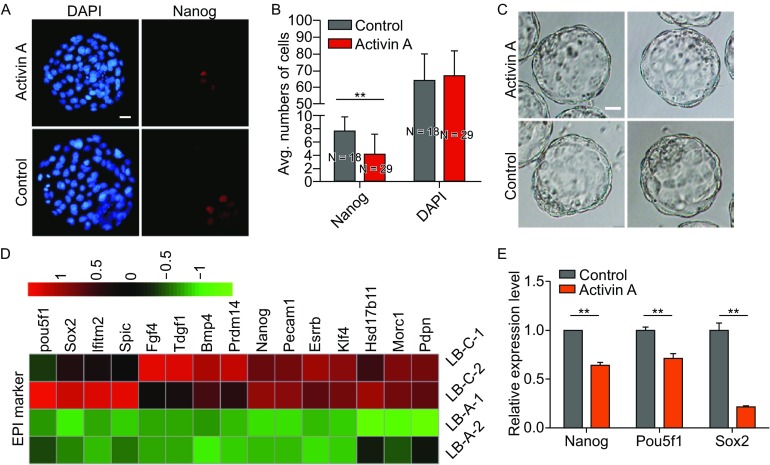
Figure 3.

Activin A represses EPI lineage. (A) Nanog immunostaining in Activin A-treated and untreated embryos at E4.5. Nuclei were stained with DAPI (Blue). Scale bars, 20 μm. (B) Average numbers of EPI cells (Nanog-positive cells) in Activin A-treated and untreated embryos at E4.5. Error bars indicate SD. **P < 0.01 by ANOVA. N is the number of embryos examined. (C) Late blastocysts in the Activin A-treated group and the control group. Scale bars, 20 μm. (D) Heatmap of selected genes associated with EPI lineage. Heatmap was plotted with Z-score normalized RPKM. (E) Quantitative RT-PCR analyzed the expression of genes selected by heatmap of EPI Markers. Error bars indicate SD (n = 3). **P < 0.01 by Student’s t-test
