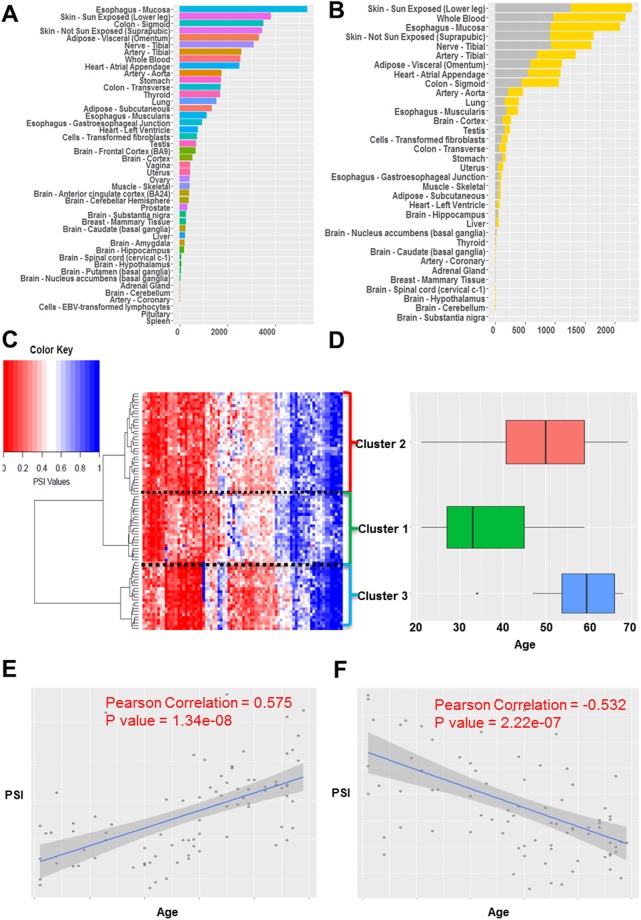
Figure 2.
Summary of significant age-associated splicing events. (A) Number of significant age-associated splicing events across 48 tissues. (B) Number of significant up-regulated (increased with aging) and down-regulated (decreased with aging) exon skipping events across 48 tissues in gray and yellow color respectively. (C) Hierarchical biclustering of top age-associated exon skipping events across individuals, based on PSI value of each event; the columns represent events and the rows represent 83 individuals with age information; blue indicates higher PSI and red indicates lower PSI. (D) Box plot of age distributions of the three identified clusters of individuals. (E) Scatter plot illustrating an up-regulated cassette exon event (COL6A3: chr2:238285987–238287279:238287878–238289558) in Uterus. (F) Scatter plot illustrating a down-regulated cassette exon event (NFE2L1:chr17:46133960–46134394:46134483–46134706) in Uterus.

