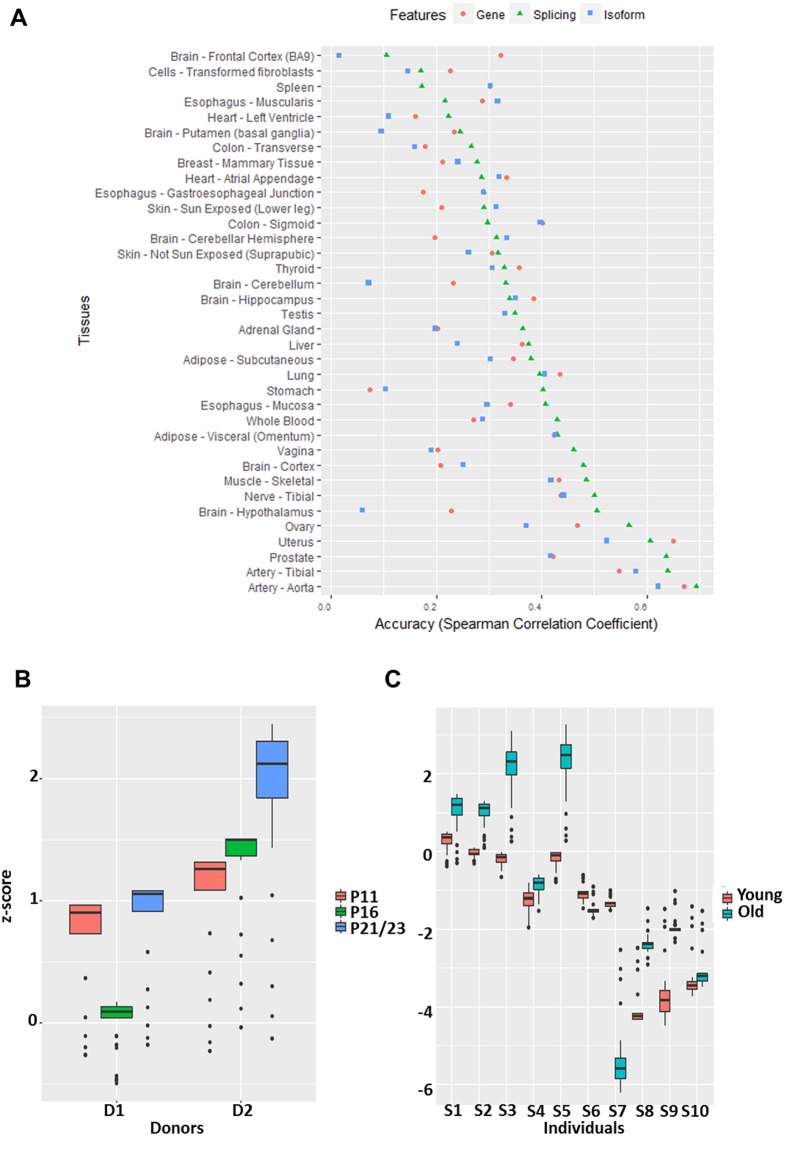
Figure 4.
(A) Accuracies of prediction of age using models based on gene expression (pink circle), splicing events (green triangle) and isoform expression (blue square) across tissues. The accuracy is measured by Spearman correlation between predicted and true ages based on cross-validation. (B) The figure shows predicted relative ages for two sets of skin fibroblast cell culture (D1 and D2) across three passages (PX: passage X). (C) The figure shows predicted relative ages of ten pairs (from individuals S1 through S10) of longitudinal skin fibroblast samples. The matched young and old samples were derived from the same individual over time. The y-axis in (B,C) denote normalized predicted age.

