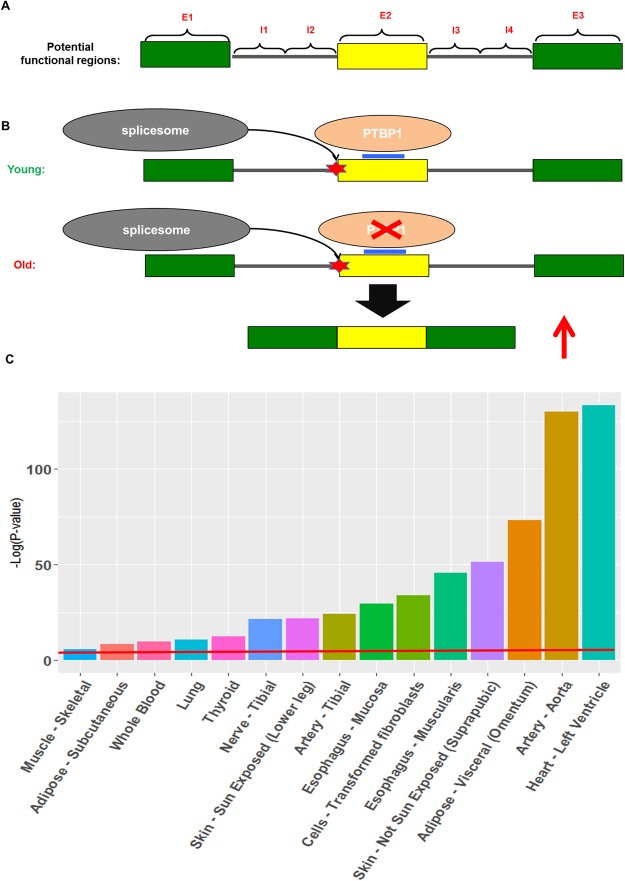
Figure 5.
(A) The 7 functional regions relative to an exon (yellow rectangle) potentially impacting the splicing event. (B) Illustration of a potential mechanism of age-associated change in exon inclusion whereby the expression of a splicing factor PTBP1, which suppresses the inclusion of the cassette exon, decreases with age, thereby resulting in an increase in exon inclusion with age. (C) Additional contribution of splicing events to the explained variance of Hypertension, in multiple tissues shown on x-axis. The y-axis denotes the significance (-log(p-value)) based on a log-likelihood ratio test. The red line indicates p-value = 0.05.

