Figure 2.
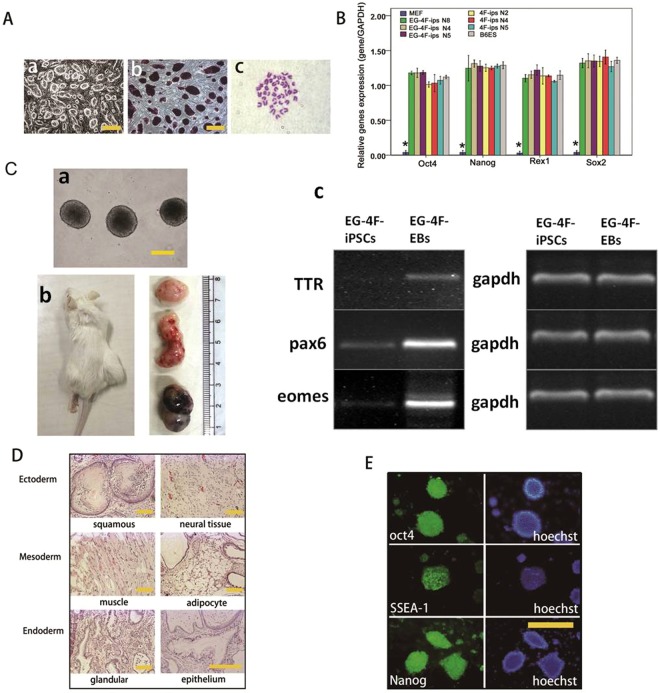
Expression of pluripotent genes, In vitro and in vivo differentiation and the of iPSCs generated by EGC extract and OSKM combination. (A-a) Morphology of EG-4F-iPSCs P15. (A-b) Alkaline phosphatase-positive colonies and (A-c) normal karyotype (20pairs). (B) Quantitative PCR analysis of pluripotent markers Oct4, Nanog, Rex1 and Sox2 in EG-4F-iPSCs. Error bars indicate standard error of the mean (n = 3). Results were normalized to GAPDH expression. *P < 0.01, versus other cells. (C-a) Embryoid body formation by suspension culture. (C-b) Teratomas. (C-c) RT-PCR analysis of germ layer markers. The grouping blots of germ layer markers were cropped from different parts of the same gel. The grouping blots of gapdh were cropped from different parts of the same gel. (D) Hematoxylin and eosin staining of teratomas. Scale bar = 50 µm. (E) Immunofluorescence staining of pluripotent genes.

