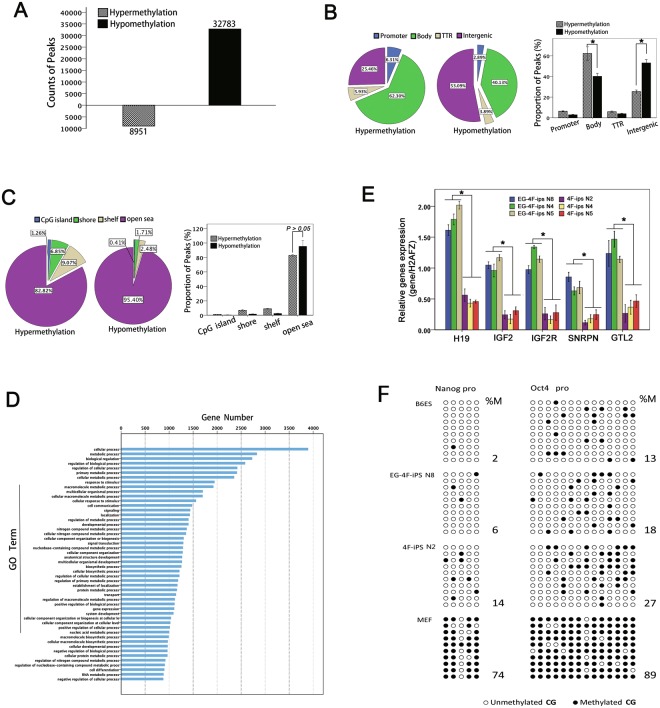
Figure 3.
Genomic methylation patterns. (A) Hypo- and hypermethylation peak counts obtained from three cell lines in each group. EG-4F-iPSC versus 4F-iPSC peaks were considered as hypermethylation peaks; 4F-iPSC versus EG-4F-iPSC peaks were considered as hypomethylation peaks. (B) Average proportions of peaks within each region as defined by genomic structure. *P < 0.05 (C) Average proportions of peaks within each region as defined by distance from the CpG island. (D) Enrichment analysis of hypomethylated genes covered with peaks. (E) Comparison of imprinted gene expression in EG-4F-iPSCs and 4F-iPSCs as quantified by mRNA expression. Error bars indicate standard error of the mean (n = 3). Results were normalized to human histone H2A.Z (H2AFZ) expression. (F) Bisulfite sequencing of Nanog and OCT4 promoter region. Black circles represent methylated sites, white circles represent unmethylated sites. Global methylated cytosines are shown as %M.

