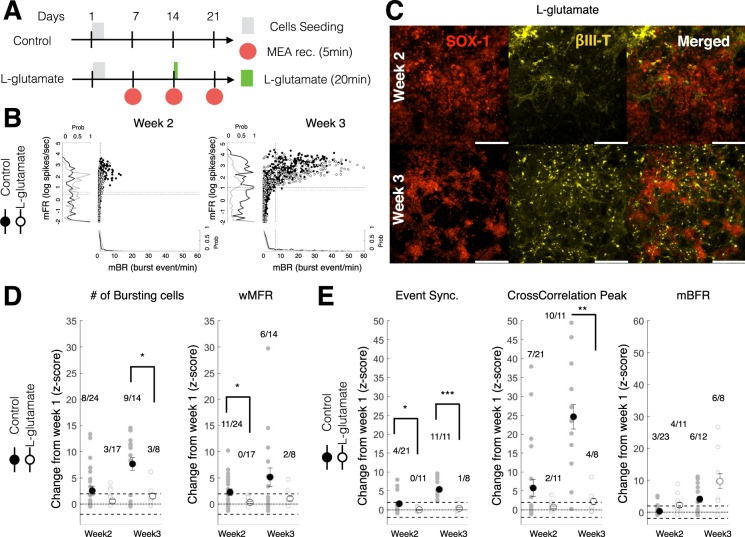
Figure 4.
Acute L-glutamate treatment impaired network activity and synchrony immediately and over a week post-administration. (A) Experimental schedule for ESC-derived neuron seeding, culture and L-glutamate treatment. In the treatment group, 100 µM of L-glutamate was administered at day14 for 20 min then washed out. MEA recordings were performed from week 1 to week 3. (B) Scatter distribution of the mean burst firing rate (mBR; Burst event/min; x-axis) against the mean firing rate (mFR; log of spike/sec; y-axis) for individual unit recorded from CTR (black filled circles) and L-glut (black open circle) groups. Data is shown for week 2 (left panel) and week 3 (right panel). The normalized distribution CTR (black line) and L-glut (gray line) groups are displayed as a projection of each axis. The dashed black line represents the average for the CTR group. The dotted black line represents the average for the L-glut group. mFR: mean firing rate for individual electrodes; mBR: mean bursting rate for individual electrodes. (C) ESC-derived neurons after L-glutamate treatment (L-glut; 100 µM for 20 min at day 14) at week 2 (top panels) and week 3 (bottom panels). From left to right panels are shown SOX-1, βIII-Tubulin and merged image of both fluorescent markers. Scale = 200 μm. (D) Change at week 2 and week 3 (expressed as a Z-score from week1 baseline) of the number of bursting cells (left panel) and weighted mean firing rate (wMFR; right panel). For each group, the number of wells with significantly increasing change over the total number of wells recorded is shown above the scatter plot. wMFR: weighted mean population firing rate. (E) Change in network synchrony at week 2 and week 3 (expressed as a Z-score from week1 baseline) for event synchronization (left panel), cross-correlation peak (middle panel) and mean network burst firing rate (mBFR; right panel). For each group, the number of wells with significantly increasing change over the total number of wells recorded is shown above the scatter plot. For post-hoc two-sample test *, ** and *** indicate p < 0.05, p < 0.01 and p < 0.001, respectively. mBFR: mean population burst firing rate.

