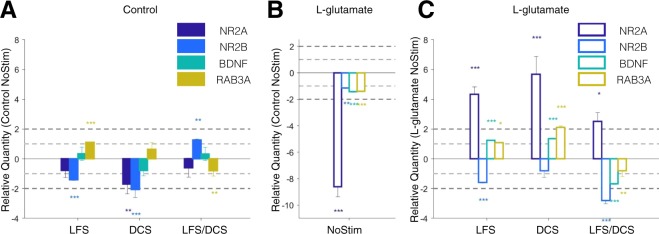
Figure 7.
DCS and LFS stimulation alters the expression profile of NR2A, NR2B, BDNF and RAB3A. (A) Relative quantity (RQ to Control NoStim) of gene expression change in response to LFS, DCS and LFS/DCS stimulation without toxicity at week 3. (B) Relative quantity (RQ to Control NoStim) of gene expression change following L-glutamate toxicity at week 3 (L-glutamate NoStim). (C) Relative quantity (RQ to L-glutamate NoStim) for gene expression change for LFS, DCS and LFS/DCS stimulation following L-glutamate toxicity at week 3. Data is shown as mean +/−SEM. *, ** and *** indicate p < 0.05, p < 0.01 and p < 0.001, respectively, on two-sample student t-test between test and control samples (n = 6 repeats per group). Light and dark gray dashed lines mark 1- and 2 fold change in expression. Bar plots in order from left to right represent NR2A: NMDA receptor sub unit 2A, NR2B: NMDA receptor sub unit 2B, BDNF: brain-derived neurotrophic factor, RAB3A: RAS-related protein rab3.

