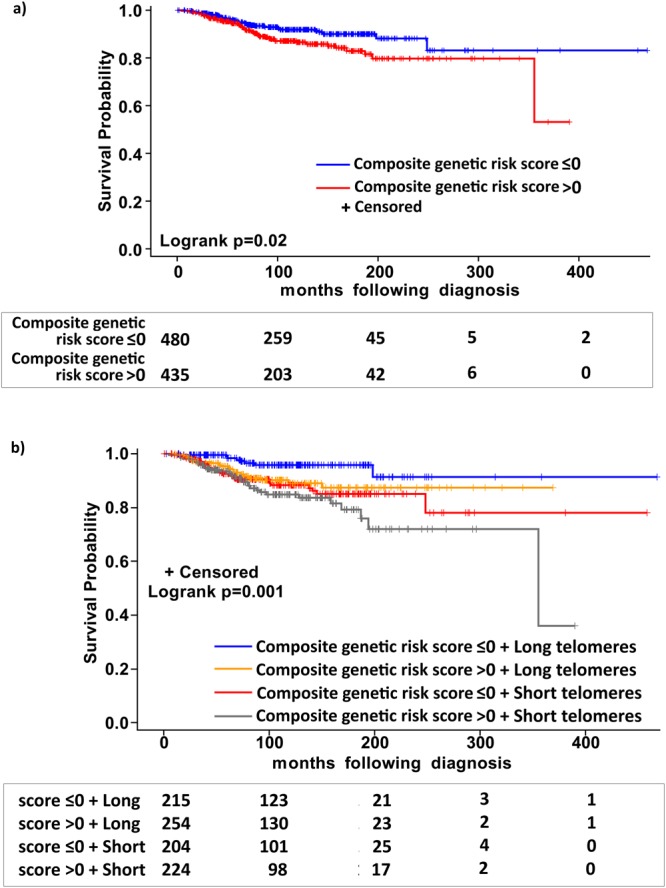
Figure 2.

Kaplan-Meier analysis of difference in survival in patients with Stage I and II melanoma; (a) after stratification based on the median distribution of composite weighted genetic score; (b) after stratification into four sub-groups based on median distributions of composite weighted genetic score and telomere length (i) with composite genetic score ≤0 and long telomeres (ii) with composite genetic score >0 and long telomeres (iii) with composite genetic score ≤0 and short telomeres and (iv) with composite genetic score >0 and short telomeres. The numbers of patients at risk in each category are shown underneath at the respective survival intervals.
