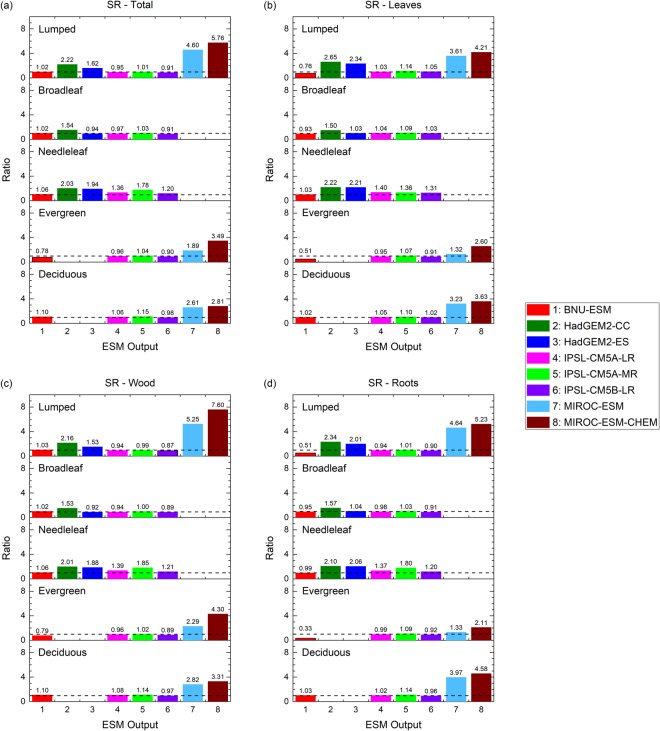
Figure 8.
Ratios for global mean relative errors of masked carbon mass at grid cell level during the pre-industrial period to that during the contemporary period at Ff = 0. Forest compartments include (a) all compartments, (b) leaves, (c) wood, and (d) roots. The colors and model numbers are the same as used in Fig. 4. Forest types in each sub-panel (top to bottom): lumped, broadleaf, needleleaf, evergreen, and deciduous trees. Dashed lines represent SR = 1. [The figure was made using the Origin software (OriginLab, Northampton, MA, USA)].

