Fig. 3.
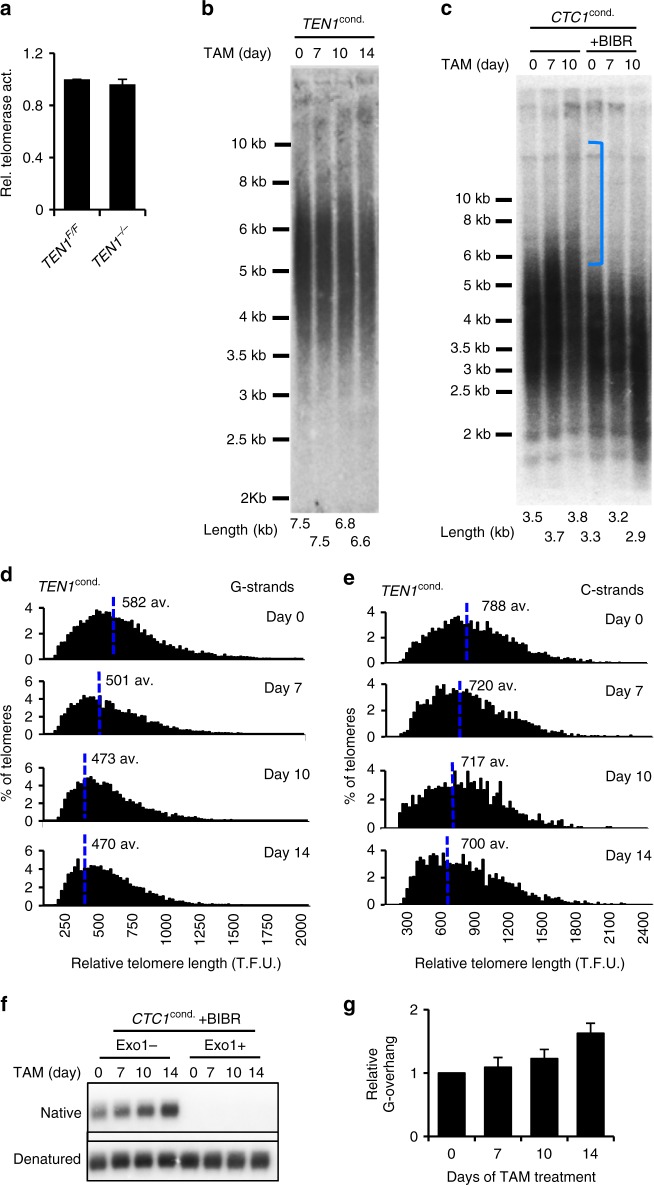
TEN1 disruption results in telomere shortening without G-strand overextension. a Quantification of TRAP assay showing telomerase activity in TEN1 conditional cells with/without 14 days tamoxifen treatment. b c Southern blots showing terminal restriction fragments in TEN1 (b) or CTC1 (c) conditional cells treated with tamoxifen for the indicated times. Mean telomere length is indicated below each lane. c Cells were grown with/or without BIBR1532 for 14 days. Bracket indicates telomere elongation. d e Analysis of telomere length by Q-FISH. Metaphase spreads were hybridized with (C3TA2)3 G-strand probe (d) or (G3AT2)3 C-strand probe (e). Histograms show distribution of relative telomere lengths expressed as fluorescence intensity (TFU telomere fluorescence unit). A minimum of 100 TFU was set as the cut-off. av.; median value, also shown by blue line. >2000 telomeres quantified per sample. f g G-overhang analysis in CTC1 conditional cells after BIBR1532 treatment. f Gel showing hybridization of TAA(C3TA2)3 probe under native and denaturing conditions. g Quantification of G-overhang abundance. Signal from CTC1−/− cells was normalized to that of CTC1F/F (day 0) cells. Error bars indicate mean ± S.E.M., n = 3 independent experiments

