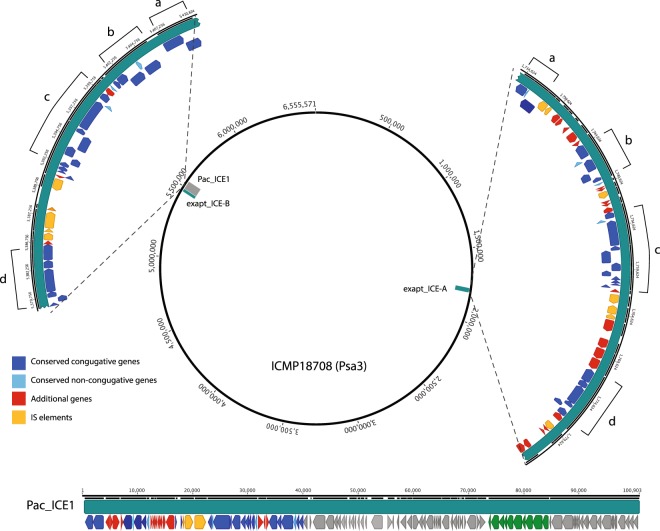
Figure 4.
Exapt_ICEs in the New Zealand Psa3 genome. A description of the position in the ICMP18708 genome, and the gene content of exapt_ICE-A and exapt_ICE-B. The arrows represent open reading frames, which are coloured according to their predicted protein products. Green arrows in Pac_ICE1 represent the pil gene array, grey arrows represent ORFs not present in the exapt_ICEs. Sections marked with the same letter correspond to homologous sequences.

