Figure 5.
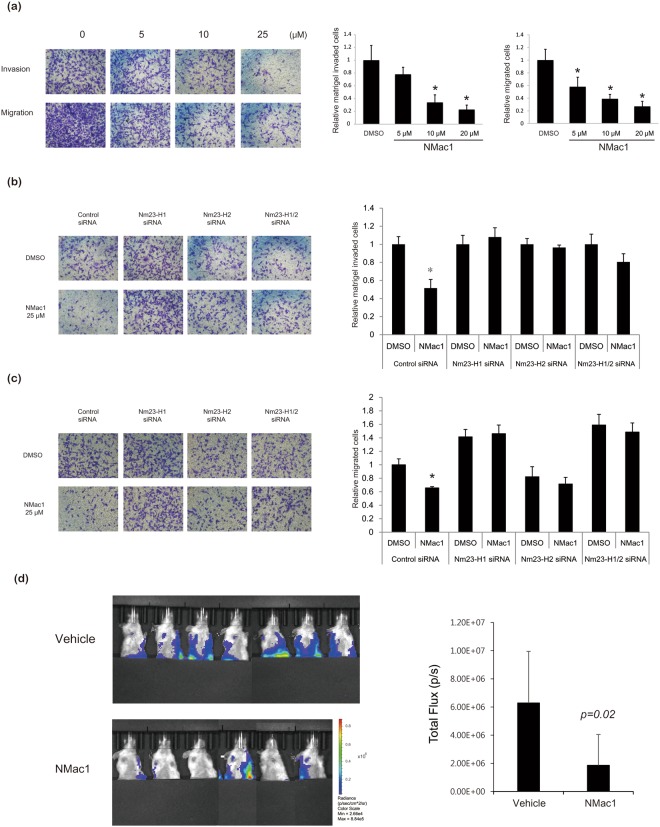
Effects of NMac1 on in vitro invasion/migration of MDA-MB-231 cells and in vivo metastasis. (a) NMac1 inhibits transwell migration and matrigel invasion of MDA-MB-231 cells. MDA-MB-231 cells treated with indicated concentrations of NMac1 were allowed to migrate in Boyden chambers for 24 hours. Bars indicate percentage of migration and invasion. *P < 0.05, Student’s t-test. (b) NMac1 inhibits matrigel invasion of MDA-MB-231 cells via Nm23-H1 and H2. Nm23-H1 or (/and) H2 knocking down MDA-MB-231 cells treated with 25 µM of NMac1 were allowed to invaded in matrigel coated Boyden chambers for 24 hours. Bars indicate amount of migration and invasion. *P < 0.05, Student’s t-test. (c) NMac1 inhibits transwell migration of MDA-MB-231 cells via Nm23-H1 and H2. Nm23-H1 or (/and) H2 knocking down MDA-MB-231 cells treated with indicated concentrations of NMac1 were allowed to migrated in Boyden chambers for 24 hours. Bars indicate percentage of migration and invasion. *P < 0.05, Student’s t-test. (d) MDA-MB-231-Luc-D3H2LN cells were orthotopically injected into NOD/SCID mice and the mice were treated with vehicle or NMac1 (n = 7 for VEH group, n = 6 for NMac1 group). (Left) Bioluminescence images visualizing the metastatic tumor cells. (Right) Quantification of bioluminescence images 3 weeks after the NMac1 treatment. Data are presented as mean total photon flux per second ± S.D.

