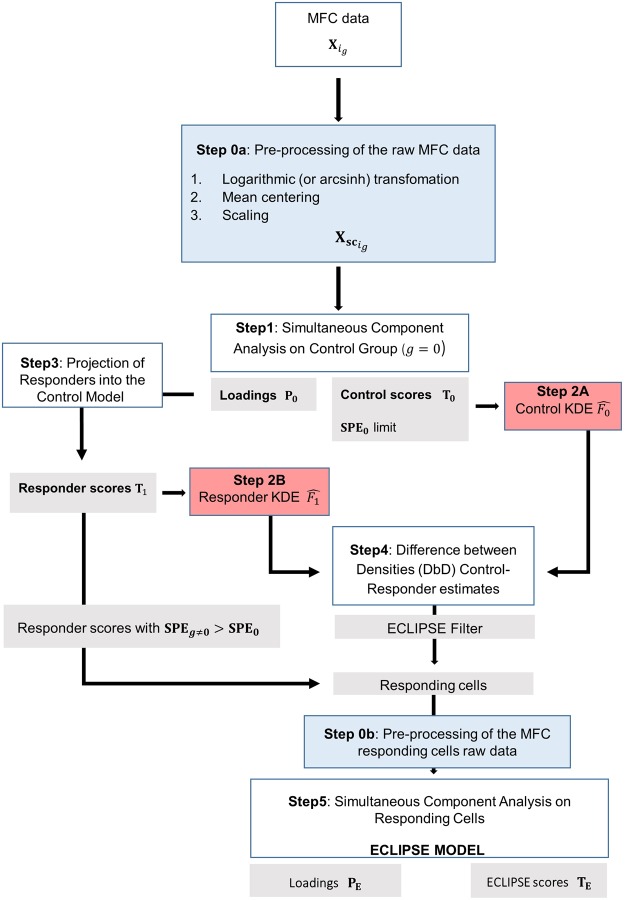
Figure 1.
Flowchart of the ECLIPSE algorithm. In light blue are highlighted the pre-processing steps (0a: pre-processing on the raw MFC data, 0b: pre-processing on the raw MFC data, after removal of normal cells); in red the probability densities distribution estimations (2A: estimate of control PDF, 2B: estimate of responder PDF, from the projection of responder-group cells); in grey the results of the corresponding previous steps.

