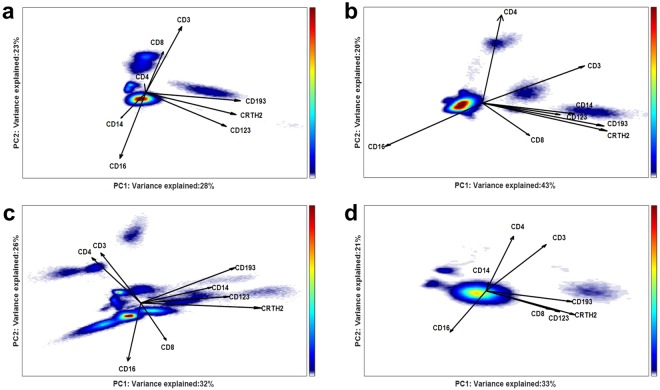
Figure 10.
Partial cluster-specific ECLIPSE response models. a Density estimation of cell scores distribution of patients #63 and 67 grouped in the green cluster; b Density estimation of cell scores distribution of patients #49 and 68 grouped in the blue cluster; c Density estimation of cell scores distribution of patients #65, 30, 46, 66, 78 and 29 grouped in the red cluster; d Density estimation of cell scores distribution of patient #48 (black individual). Both axes report the variance explained in total for the patients of each group by the respective PCs of the partial cluster-specific ECLIPSE Models. The 4 models are qualitatively comparable in terms of percentage of variance explained. However, great difference in the loadings indicates that the type of variation accounted by each model is non-identical: each patient cluster is defined by a different and characteristic combination of cell populations.

