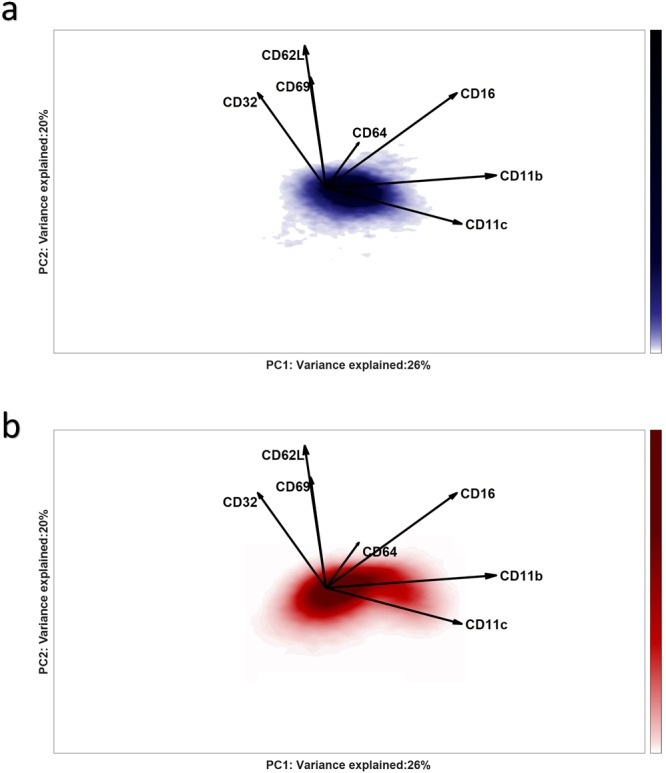
Figure 3.

Panel a, Biplot representation of PDF of the control scores, estimated with KDE; Panel b, Biplot representation of the PDF of the responder scores, estimated with KDE. The loadings of the SCA Control Model are plotted as vectors: their length indicates the contribution of each marker to the cell-to-cell variability; the mutual directions suggest a positive (same direction) or negative (opposite direction) co-expression. An angle of 90 between the direction of the vectors indicates no co-expression.
