
Figure 4.
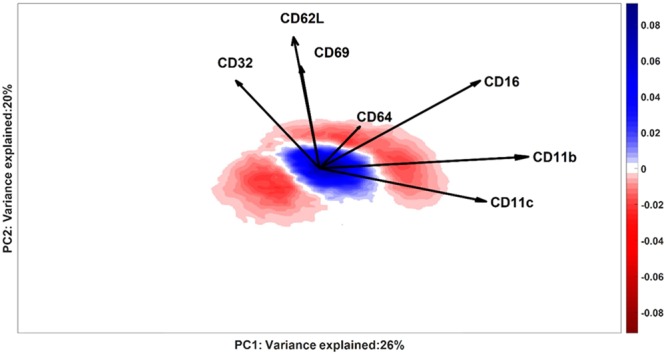
KDE of the scores distribution of a typical LPS-responder (ID #9) is subtracted from the cumulative KDE of the control scores distribution. The negative intensity (red) indicates the location where cells over-produced in the responder are more likely to be present; the positive intensity (blue) indicates the location where healthy cells are more likely to be present. The white area between the red and blue areas corresponds to a value of KDE = 0, which can indicate bins with no cells or equal intensity of control and responder estimates. The axes report the variance of ID#9 explained by the respective PCs (Control Model).